Tibco Cloud Spotfire vs DataFocus Cloud
Software-as-as-Service (SaaS) products delivers applications over internet as a service. There is no need to download software, users can access it through websites. As SaaS platforms, Tibco Cloud Spotfire and DataFocus Cloud (DFC) build bridges between insights and outcomes.
DFC utilizes search-based analysis to provide an efficient and convenient system for users to design their own visualizations and collaborate with each other.
With regard to interfaces, ease of use, visualizations, etc, the two products have various differences. This article explains the comparison between the two SaaS tools to help users find a fittable one.
1. Introduction
Tibco Cloud Spotfire is designed for visualization and discovery of data. Through insightful as well as immersive exploration, decision makers can discover valuable information using one decision platform.
DataFocus Cloud translates data with exquisite visualizations to help business elites with different roles make data-driven decisions. Its search-based analysis makes visualization as simple as Google search.
2. Comparison
Comparisons are derived from free-trial versions.
2.1 Interface
The main difference between in the interfaces of the two platforms is that:
Tibco Cloud Spotfire utilizes flyouts to provide options for data, analytics, and resources;
DataFocus Cloud utilizes modules to separate different parts of the system.
2.1.1 Navigation Bar
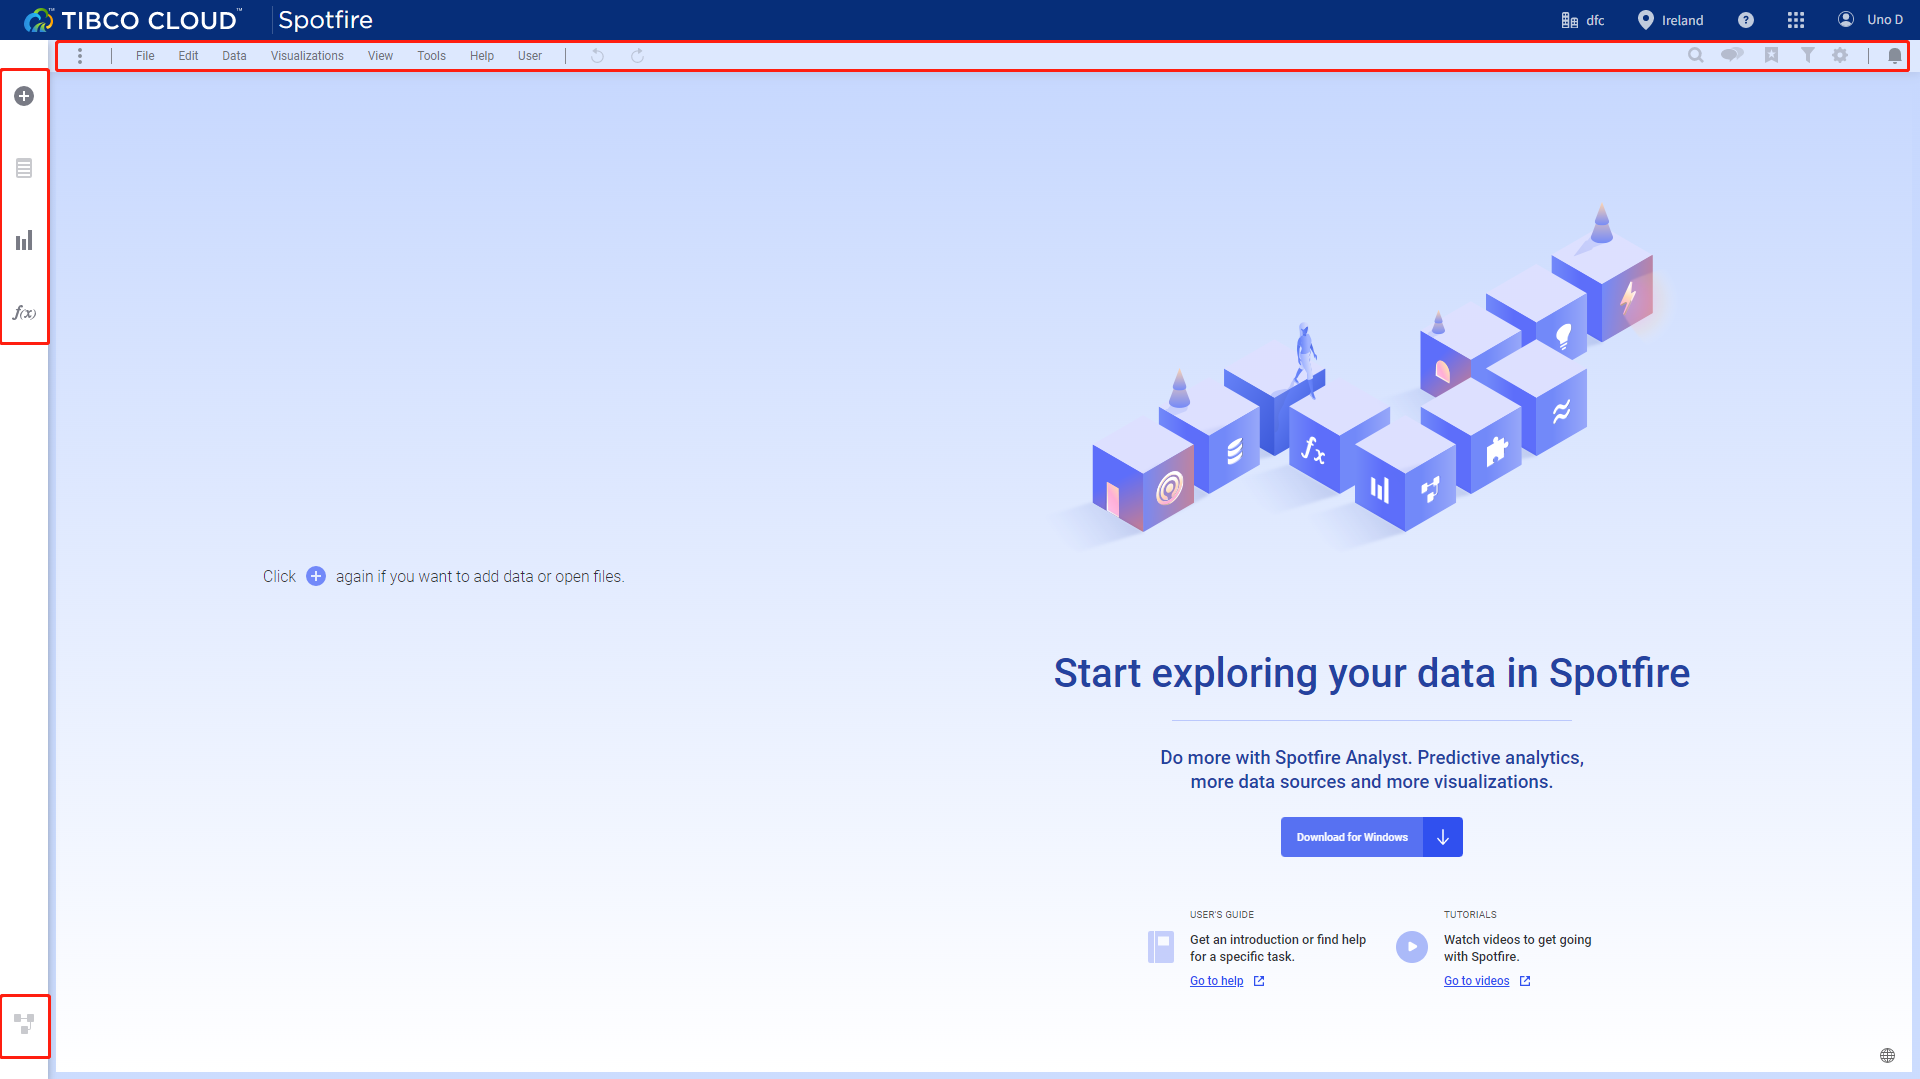
Tibco Cloud Spotfire has two navigation bars. The left navigation bar is called the authoring bar, and lists 5 modules, files and data, data in analysis, visualization types, analytic tools, and data canvas. These modules will be introduced later. The top navigation bar is called the menu bar, and displays options for different features and displays some toolbars.
DFC also owns two navigation bars. The left one exhibits 10 function modules, such as “Search”, “Answer”, “Resource”, etc., and will be explained more below. The top one lists some important dashboards selected by users themselves to view at any time.
2.1.2 Data
-
Tibco Cloud Spotfire
Through the “Files and data” flyout, users can add new data or open existing analytics. Under “Data in analysis” flyout, click one column name to get more details. The “Data canvas” flyout displays the data structure and offers data transformation options, as shown in figure 2-3.
GIF Figure 2-3 Data canvas - Tibco Cloud Spotfire -
DataFocus Cloud
Table modules stores all of the data tables. On the detailed page of a data table, users can change the aggregation method, geo type, etc., add or overlay data, edit relationships, preview data, and view dependent resources, and etc.
GIF Figure 2-4 Data table module
2.1.3 Analytics
-
Tibco Cloud Spotfire
The “f(x)” flyout pins some data functions to quickly perform some calculations and the “find” button from the menu bar helps search for contents, actions, etc. The former two mainly search for information, while the “Data in analysis” flyout shows details of columns as well as some suggestions towards visualizations.

GIF Figure 2-5 Analytics - Tibco Cloud Spotfire -
DataFocus Cloud
DFC’s search analysis module is where users analyze data and create visualizations. It consists of column information, search box and the canvas. Columns are displayed as attributes and measures, the search box accepts analytics thoughts, and the canvas visualizes the thoughts.
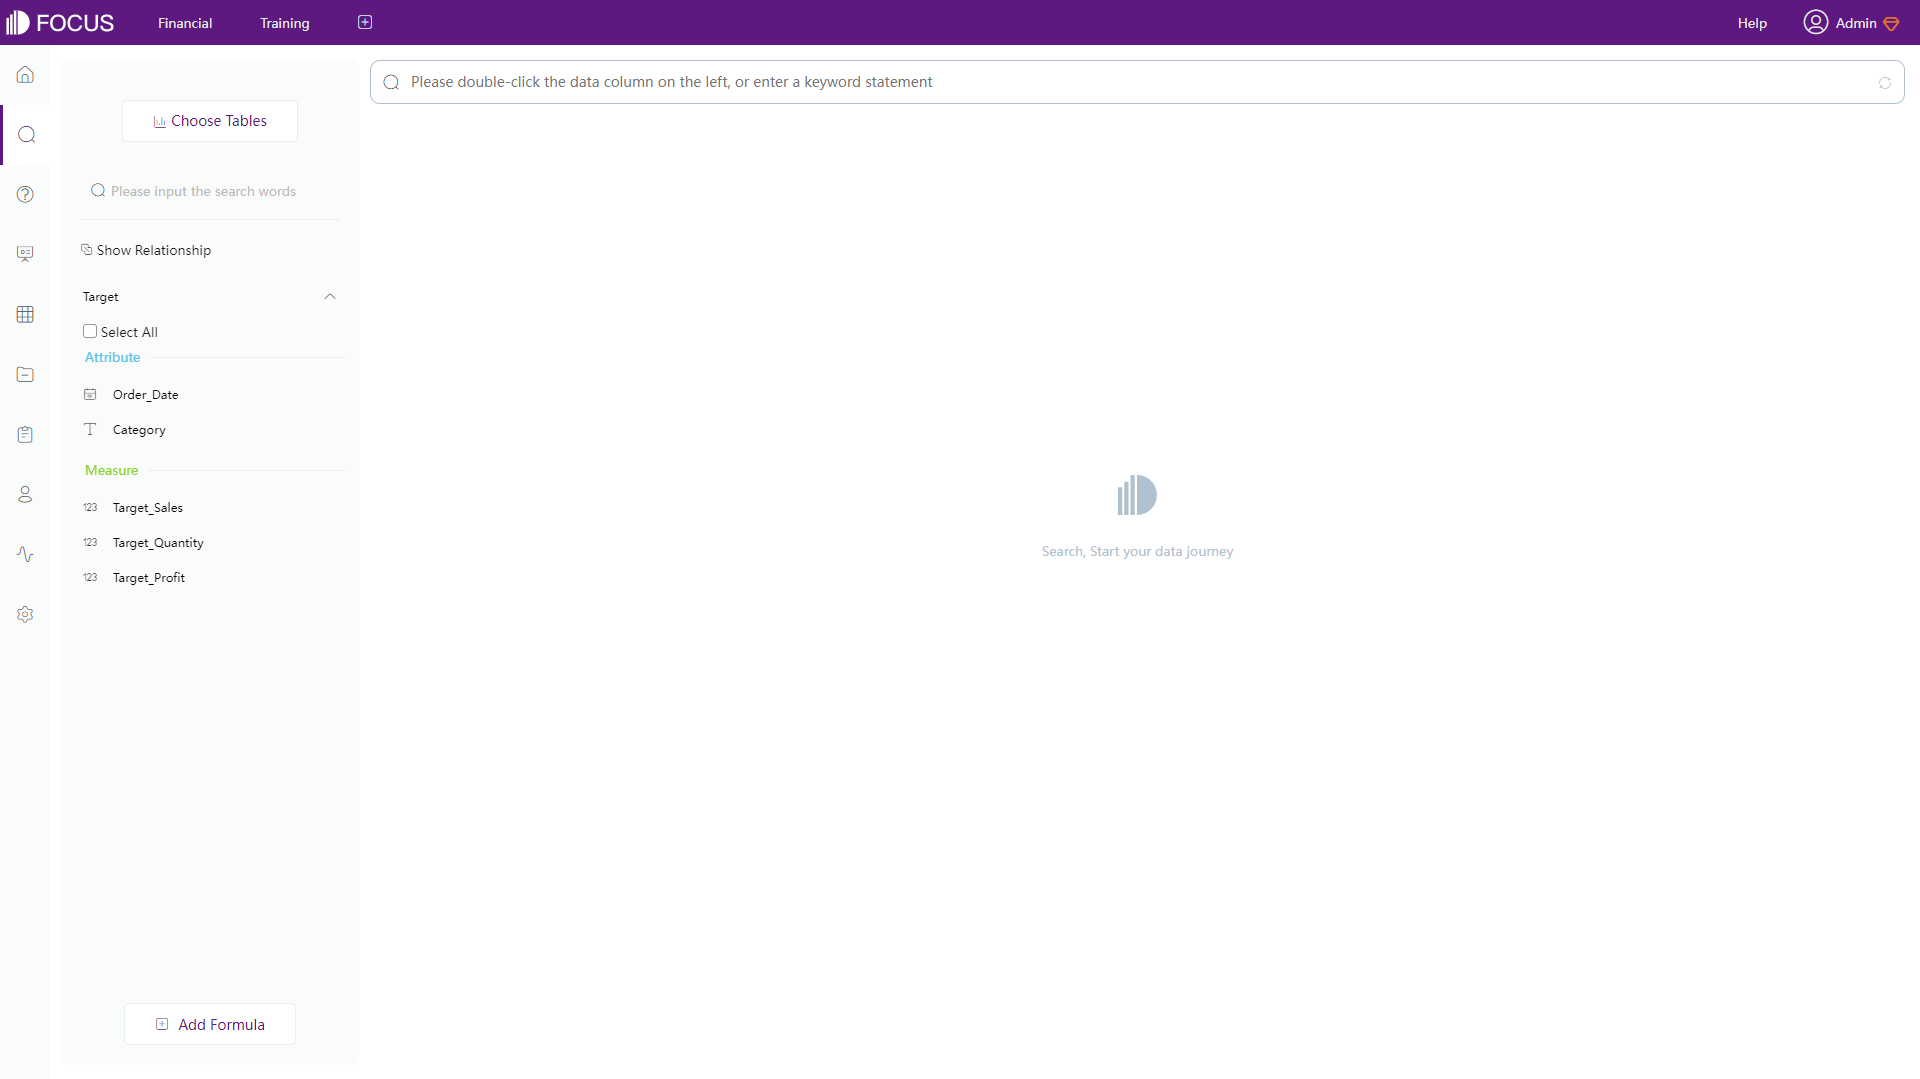
Figure 2-6 Analytics - DFC
2.1.4 Resource
-
Tibco Cloud Spotfire
Resources are listed within the “Files and data” flyout. As shown below, users can switch among “Recommended”, “Samples”, team resources, shared resources, etc.
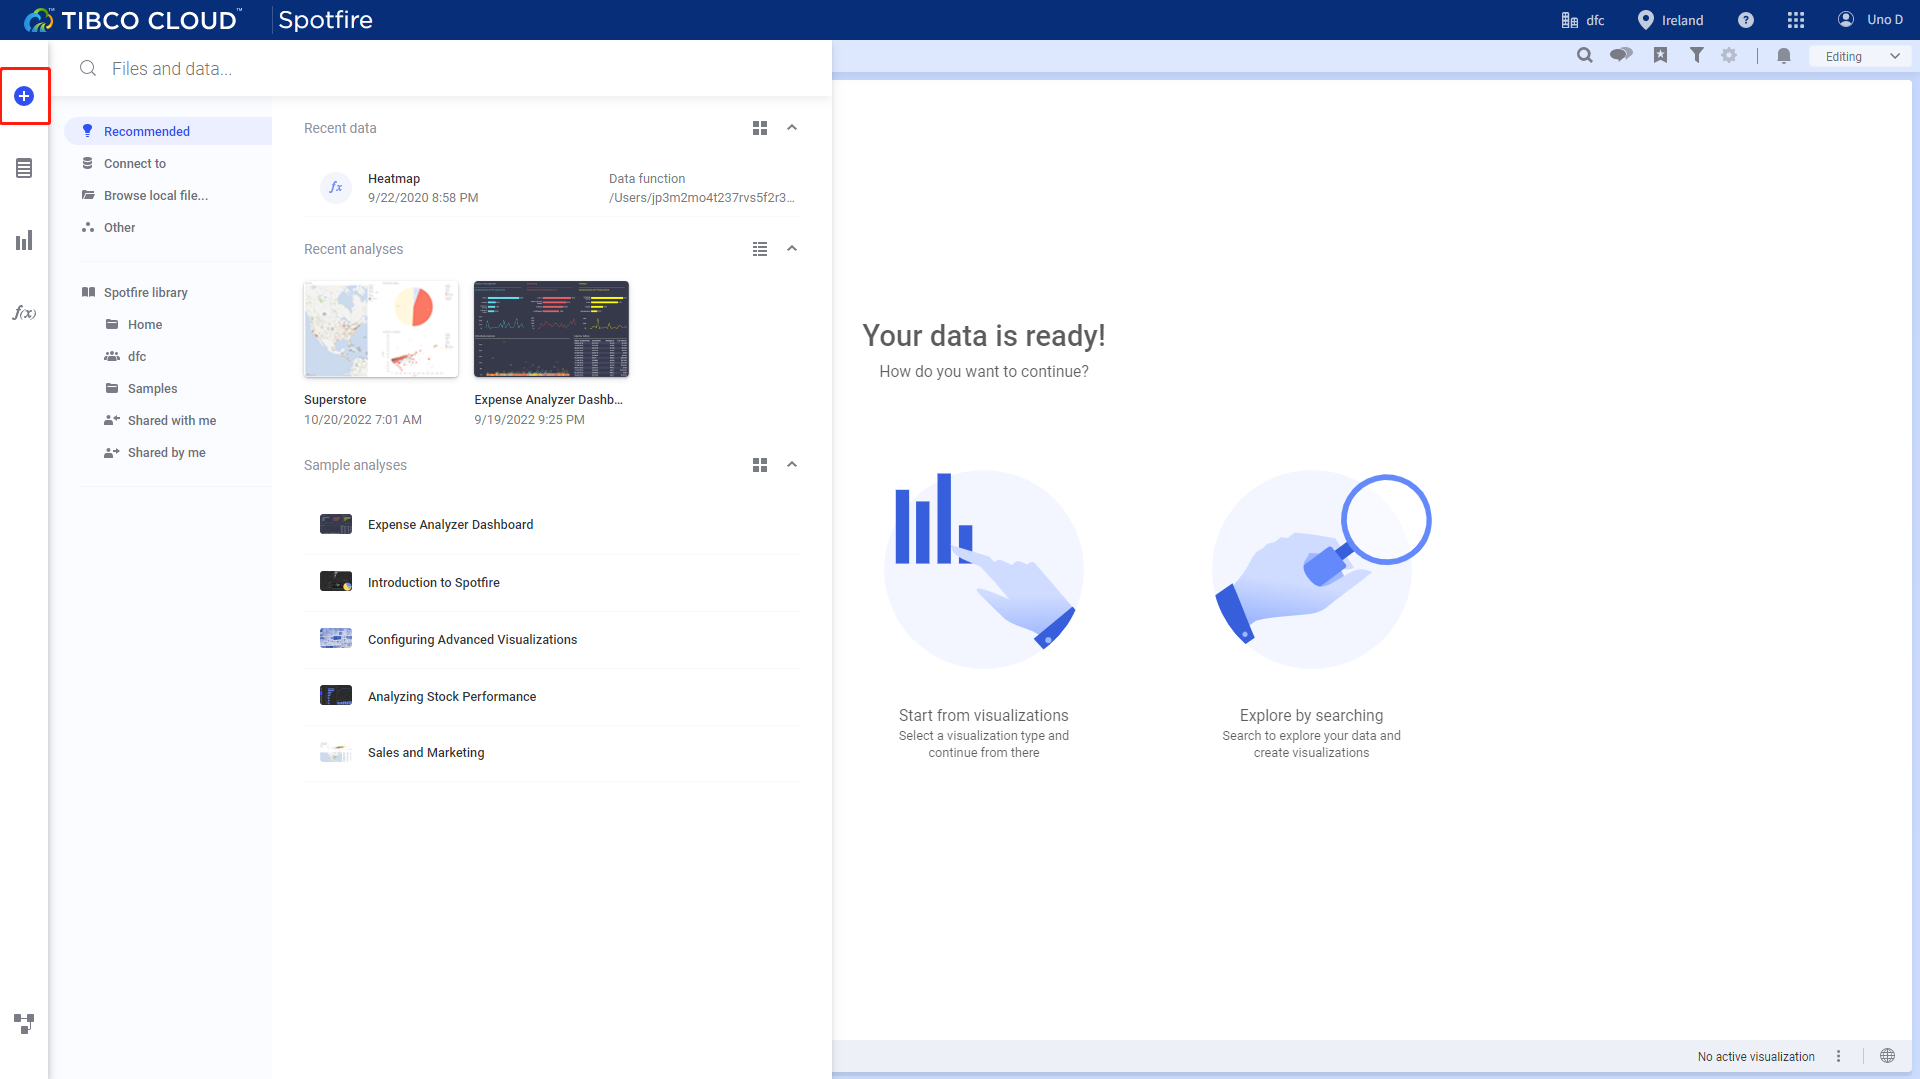
Figure 2-7 Resources - Tibco Cloud Spotfire -
DataFocus Cloud
There are different modules to organize different resources, such as answers, dashboards, tables. What’s more, there is a resource module that lists all resources, and with a navigation bar, users can switch between different kinds of resources.
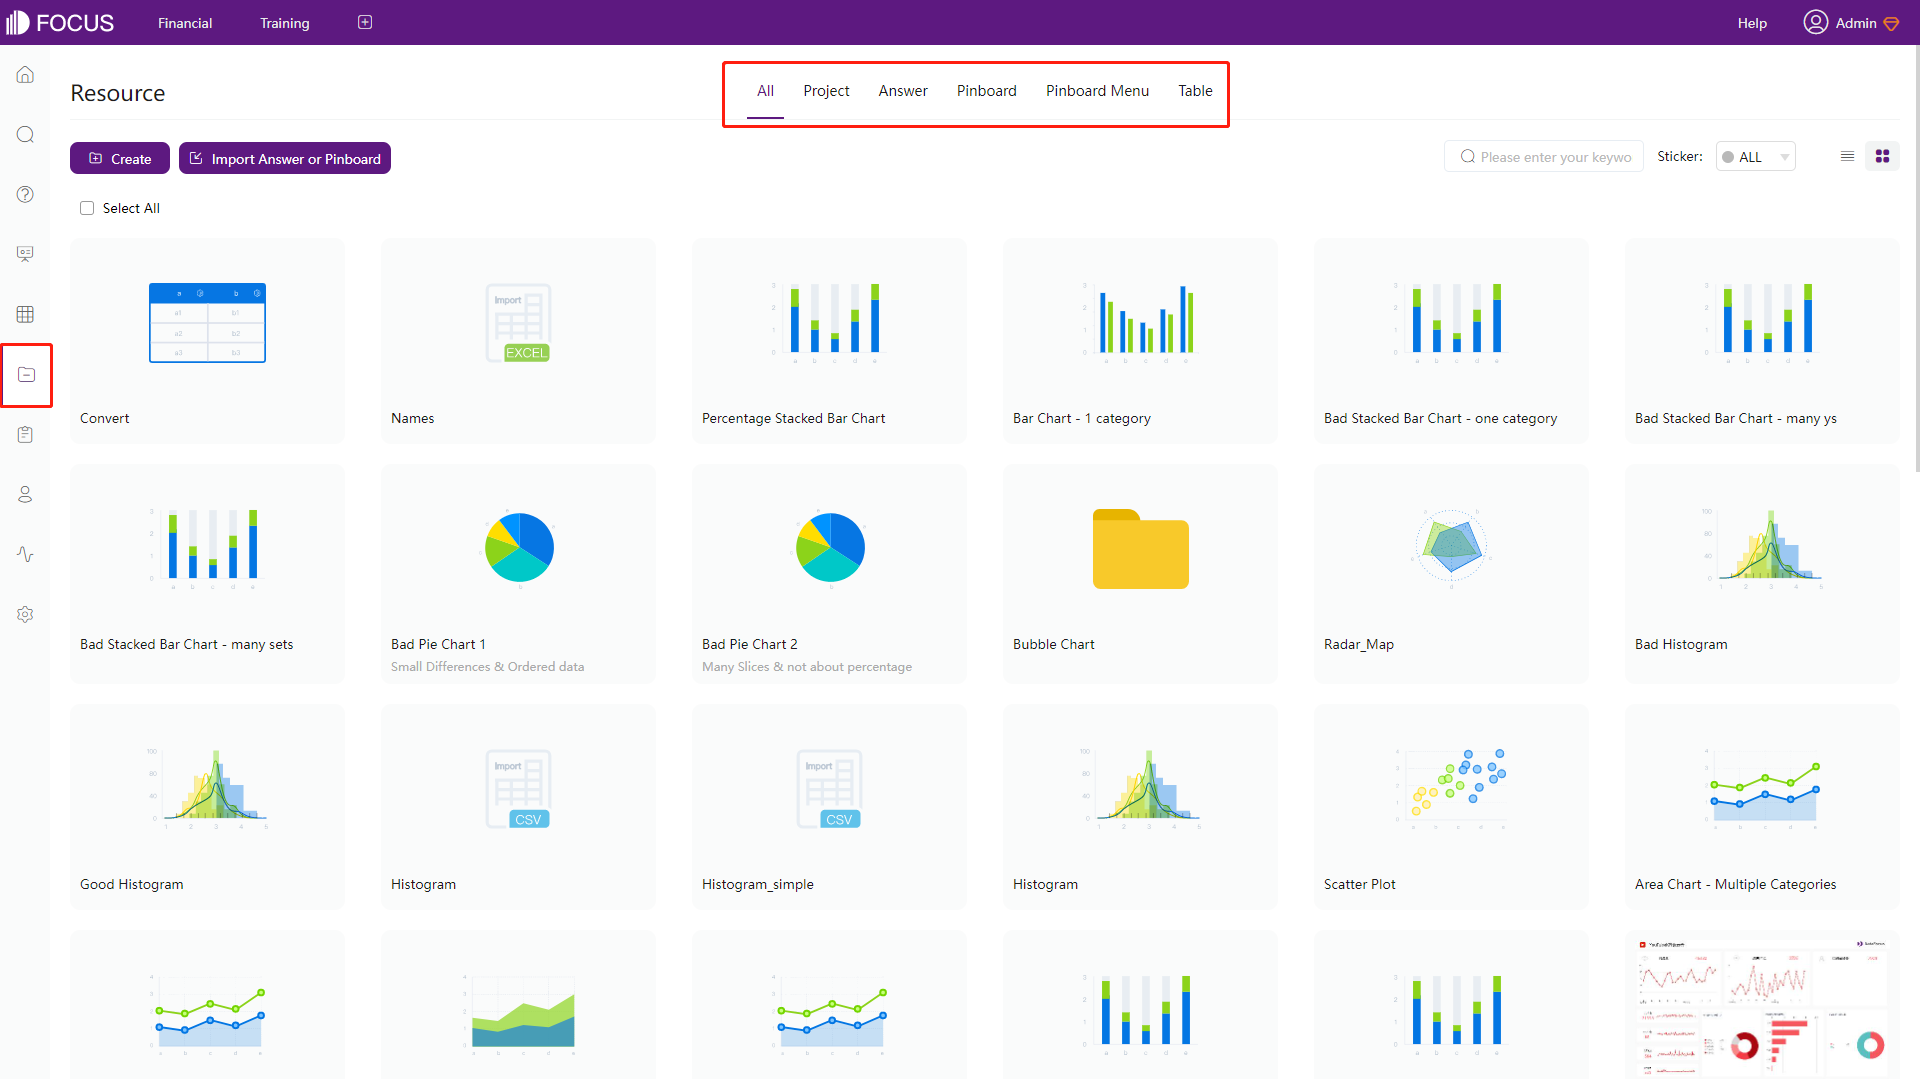
Figure 2-8 Resources - DFC
2.2 Data Source
Tibco Cloud Spotfire has two ways to load data. One is importing local data files, and users can upload several files together. Another is through data connectors. Currently, the cloud version only supports access databases directly for Salesforce and Google Analytics. To access other databases, users need to install clients first.
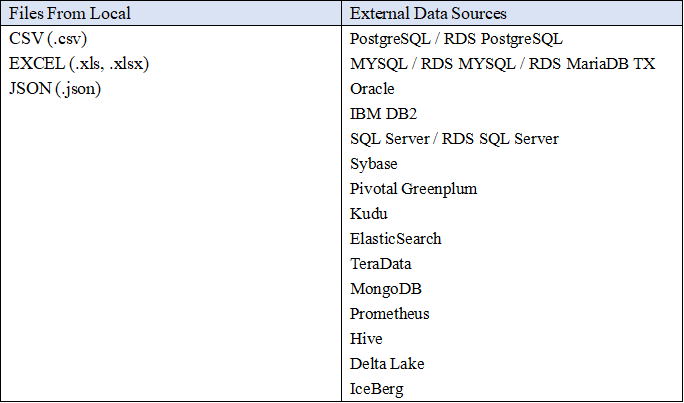
Likewise, DataFocus Cloud also supports uploading local files as well as external data source connection, and the external data sources supported are listed below in the table. Note that users can connect to multiple databases concurrently and analyze them together.
Except those 2 ways, users can also upload data warehouses into the system, which satisfies big data analysis like billions of data. What’s more, there is API to help access to trustworthy sources.
2.3 Ease of Use
2.3.1 Create Visualizations
There are three ways to analyze and visualize data in Tibco Cloud Spotfire.
-
“Data in analysis” flyout
As mentioned above in section 2.1.3, the “Data in analysis” flyout provides column details as well as visualization recommendations. Select columns and choose a chart type to analyze the data.

GIF Figure 2-10 Data in analysis flyout -
“Visualization type” flyout
Or users can select a visualization type first through the “Visualization type” flyout, the system would return a chart automatically.

GIF Figure 2-11 Visualization type flyout -
“Find” button
Except searching for information, the “find” button from the menu bar also supports visualization recommendations. Typing the column name, and it will function the same as the other two ways.
GIF Figure 2-12 Find button
In DataFocus Cloud, analyzing data and chart creation are mainly through the search bar. To add column names and other contents in the search bar, there are mainly two ways.
-
Select
Select column names from the column display area. Users can select one by one, or several together, or select all.
GIF Figure 2-13 Select columns -
Type
Directly type in the search bar. Different combinations are possible like the column names, keywords and formulas. Also, there are prompts to help decide what to search.
GIF Figure 2-14 Type in search bar
The above is about simple analytics, where basically columns are directly analyzed. When it come to complicated business questions, such as product names contain “Phone”, the growth rate, comparisons, etc., it is much easier in DFC.
With the search-based analytics, users can use various keywords to straightly complete the analysis. Here is an example showing the growth rate analysis in DFC.
2.3.2 Filter
- Tibco Cloud Spotfire
-
Marking
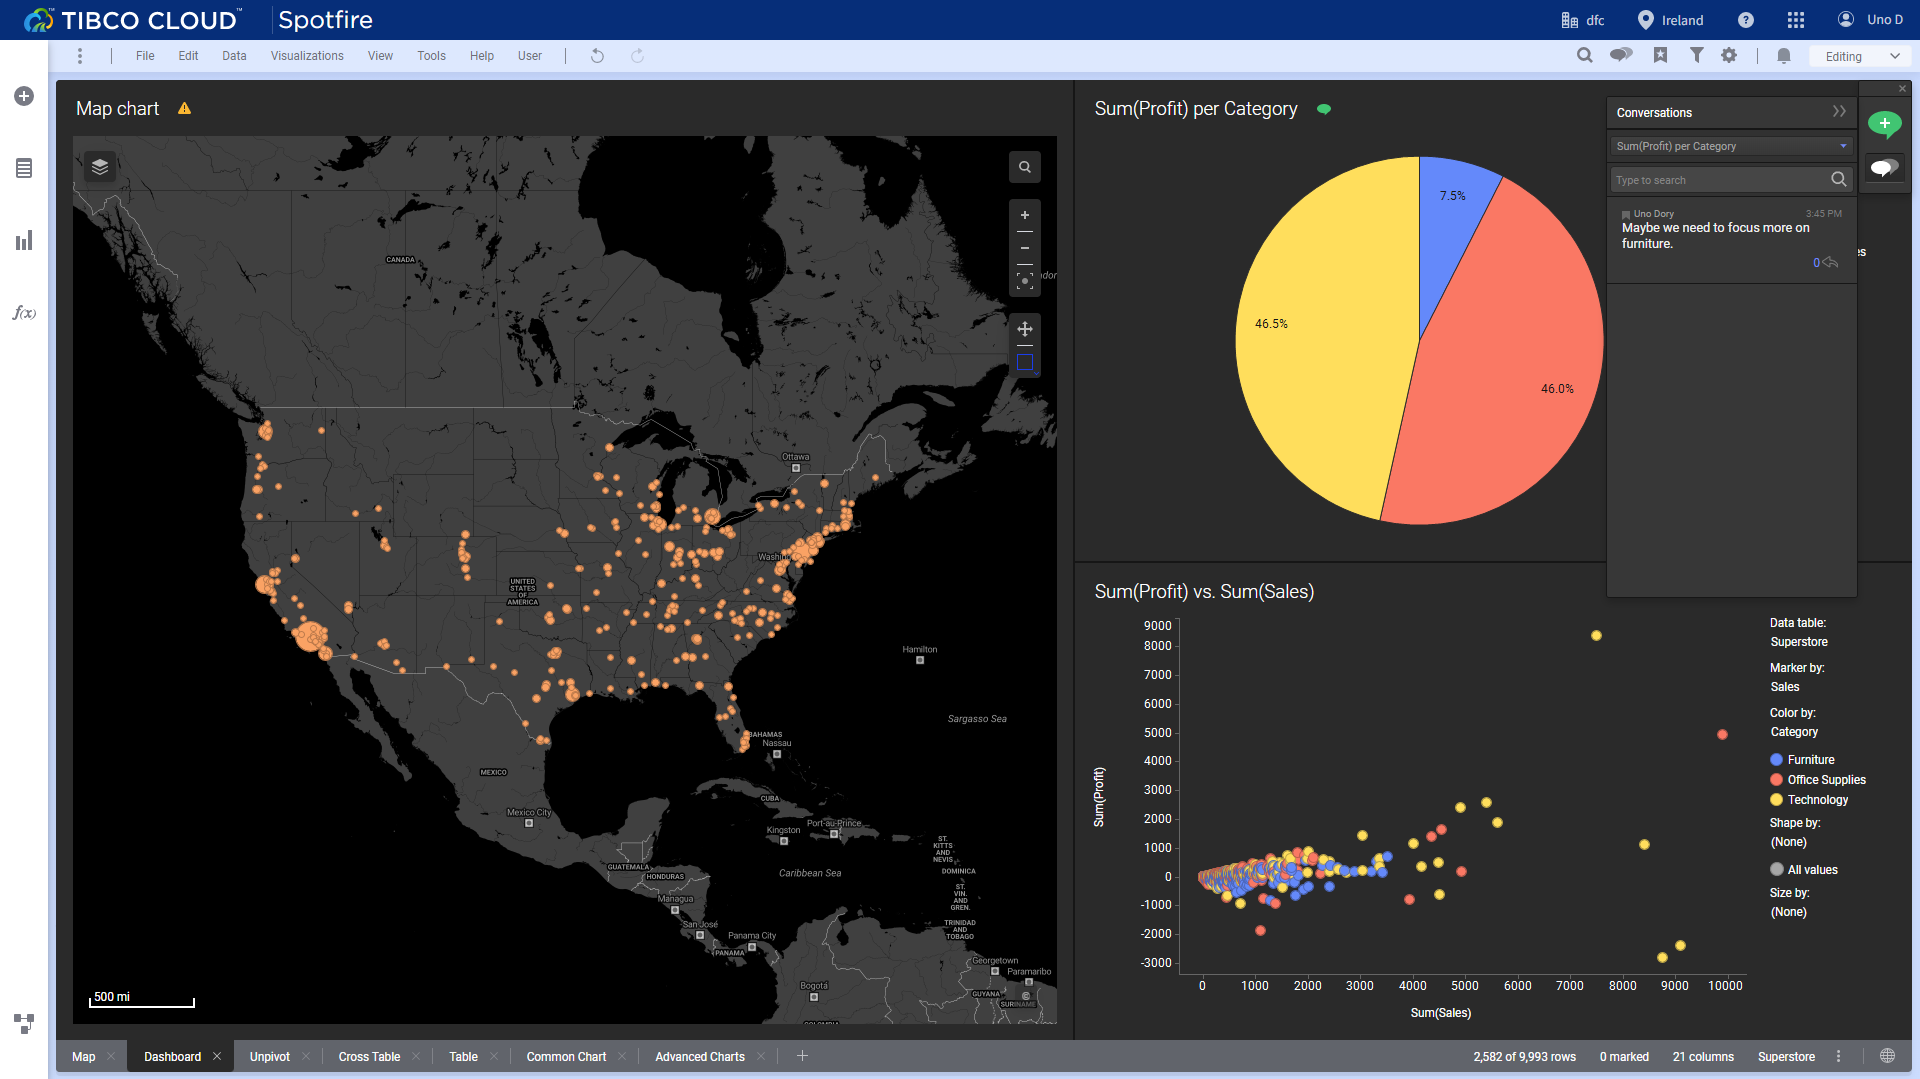
Marking is highlighting, and can be regarded as one form of filtering. Users can mark items in multiple ways such as clicking bars, lines, pie sectors, etc. When mark items in a dashboard, charts on the same page would be marked together if they are made from the same data source.
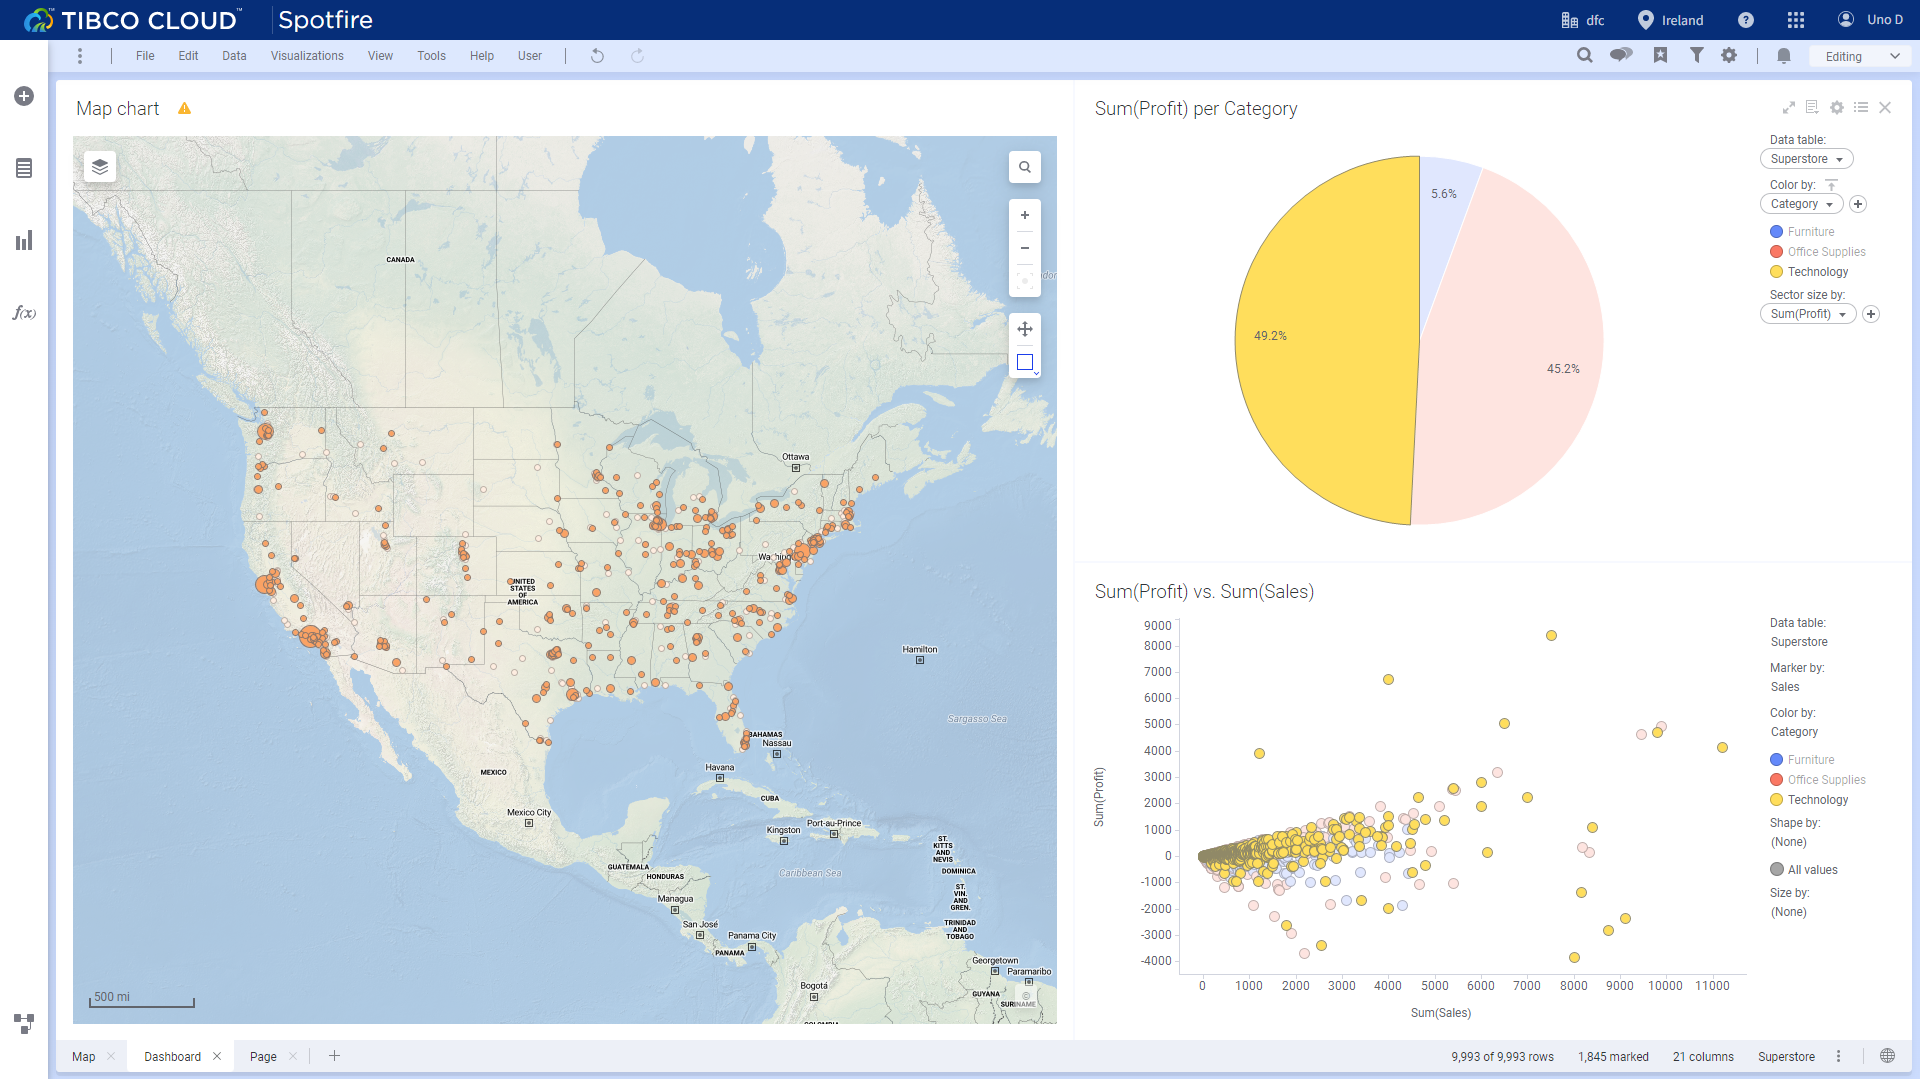
Figure 2-16 Marking -
Filter types
There are seven filter types in Spotfire, including range filters, item filters, check box filters, etc. Users can use different kinds of filter types for different values, as shown in figure 2-17.
-
Filter panel
Filter panel is on the right side of the page, and displays filters related to all of the columns in the data table. Filter conditions would appear at the bottom of the filter pane. Change filter conditions on the filter panes, and the related charts in the dashboard would be filtered together.
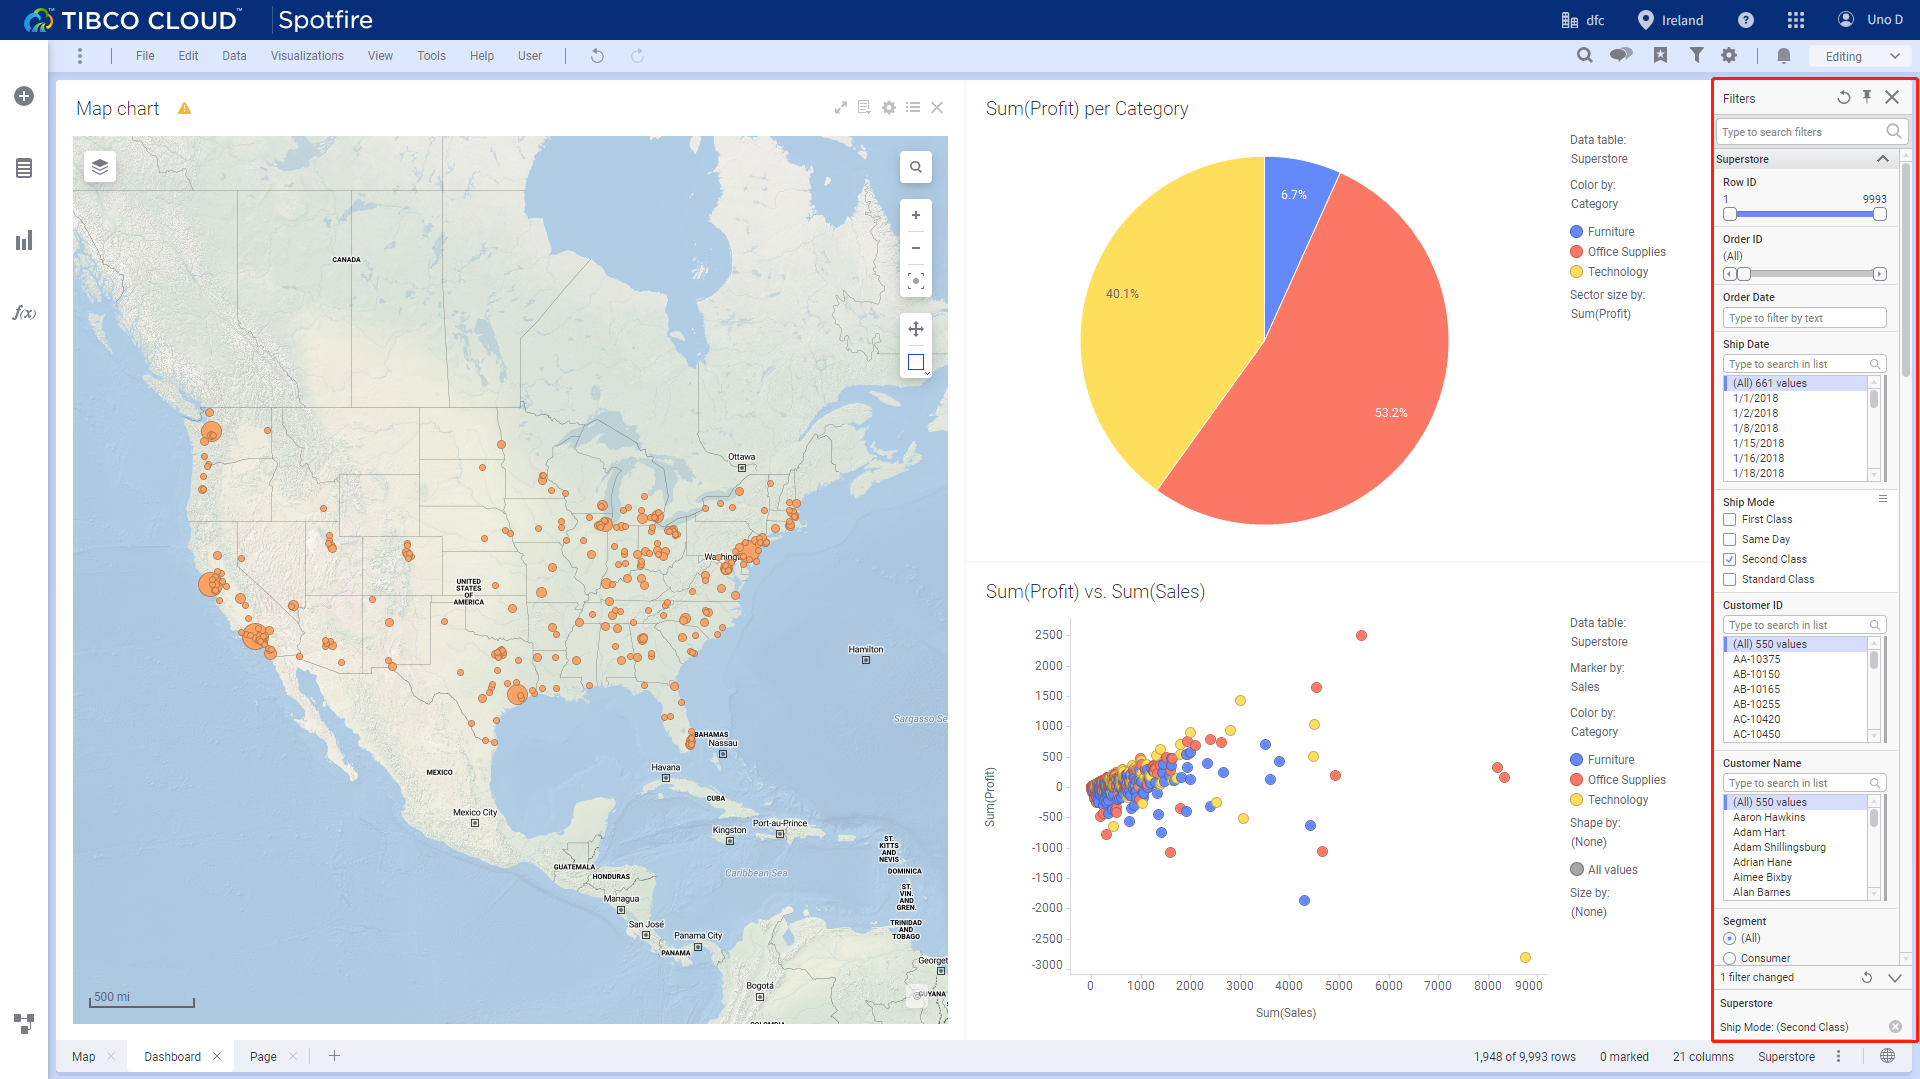
Figure 2-17 Filter pane -
“Data in analysis” flyout
Spread the “Data in analysis” flyout, and columns can be filtered through the filter icon. Similarly, filtered conditions would appear at the bottom of the flyout.
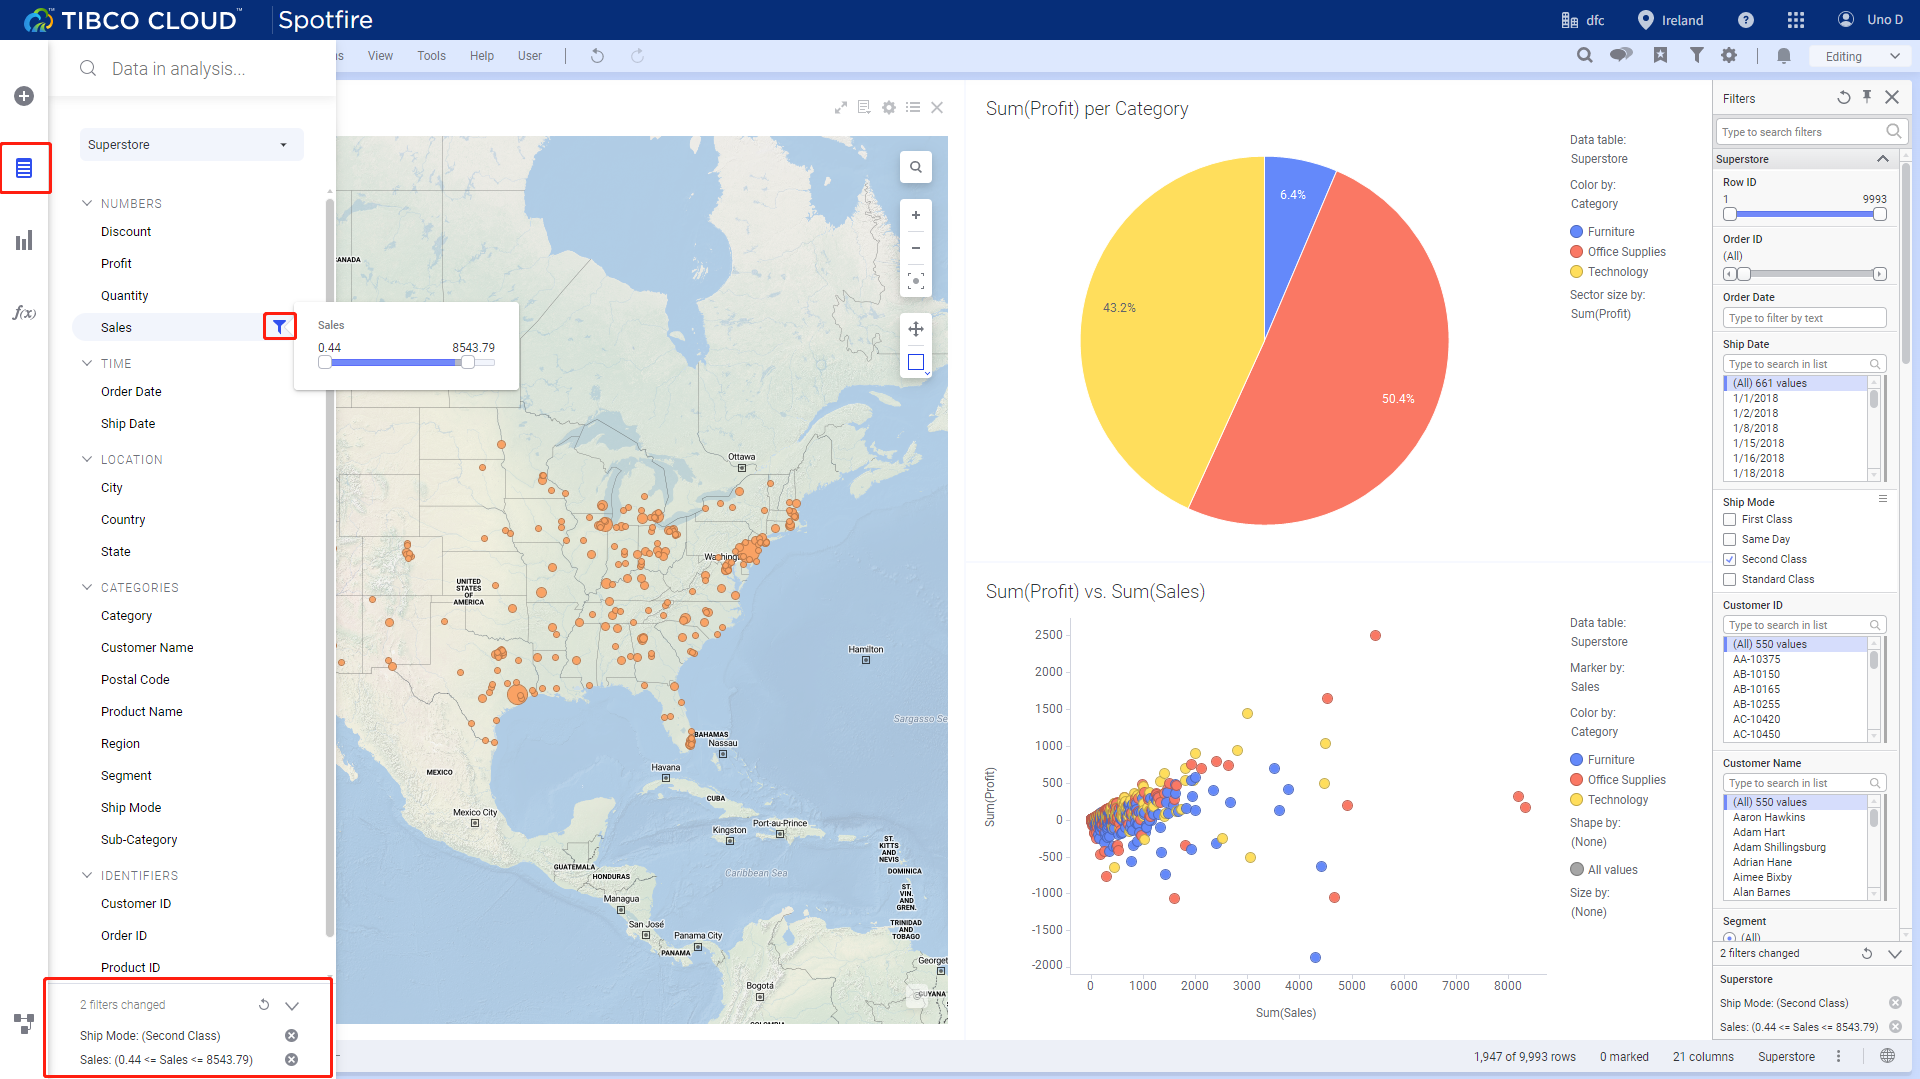
Figure 2-18 Flyout filter
- DataFocus Cloud
-
Highlighting
Similar to Spotfire’s marking, click items or select areas of charts to highlight data.
For charts, unhighlighted area would gray out if you hover over that part, and would be hidden if you select some parts for certain chart types.
GIF Figure 2-19 Highlighting charts Likewise, in dashboards, charts made from one data source would be highlighted together. However, instead of fading out the color of the unhighlighted data, some charts would change entirely.
-
Filter types
Rather than different display types, DFC offers different types for data types like time, string, and numbers. As shown below, string can be filtered in bulk, and minimum as well as maximum values are listed for the other two types.
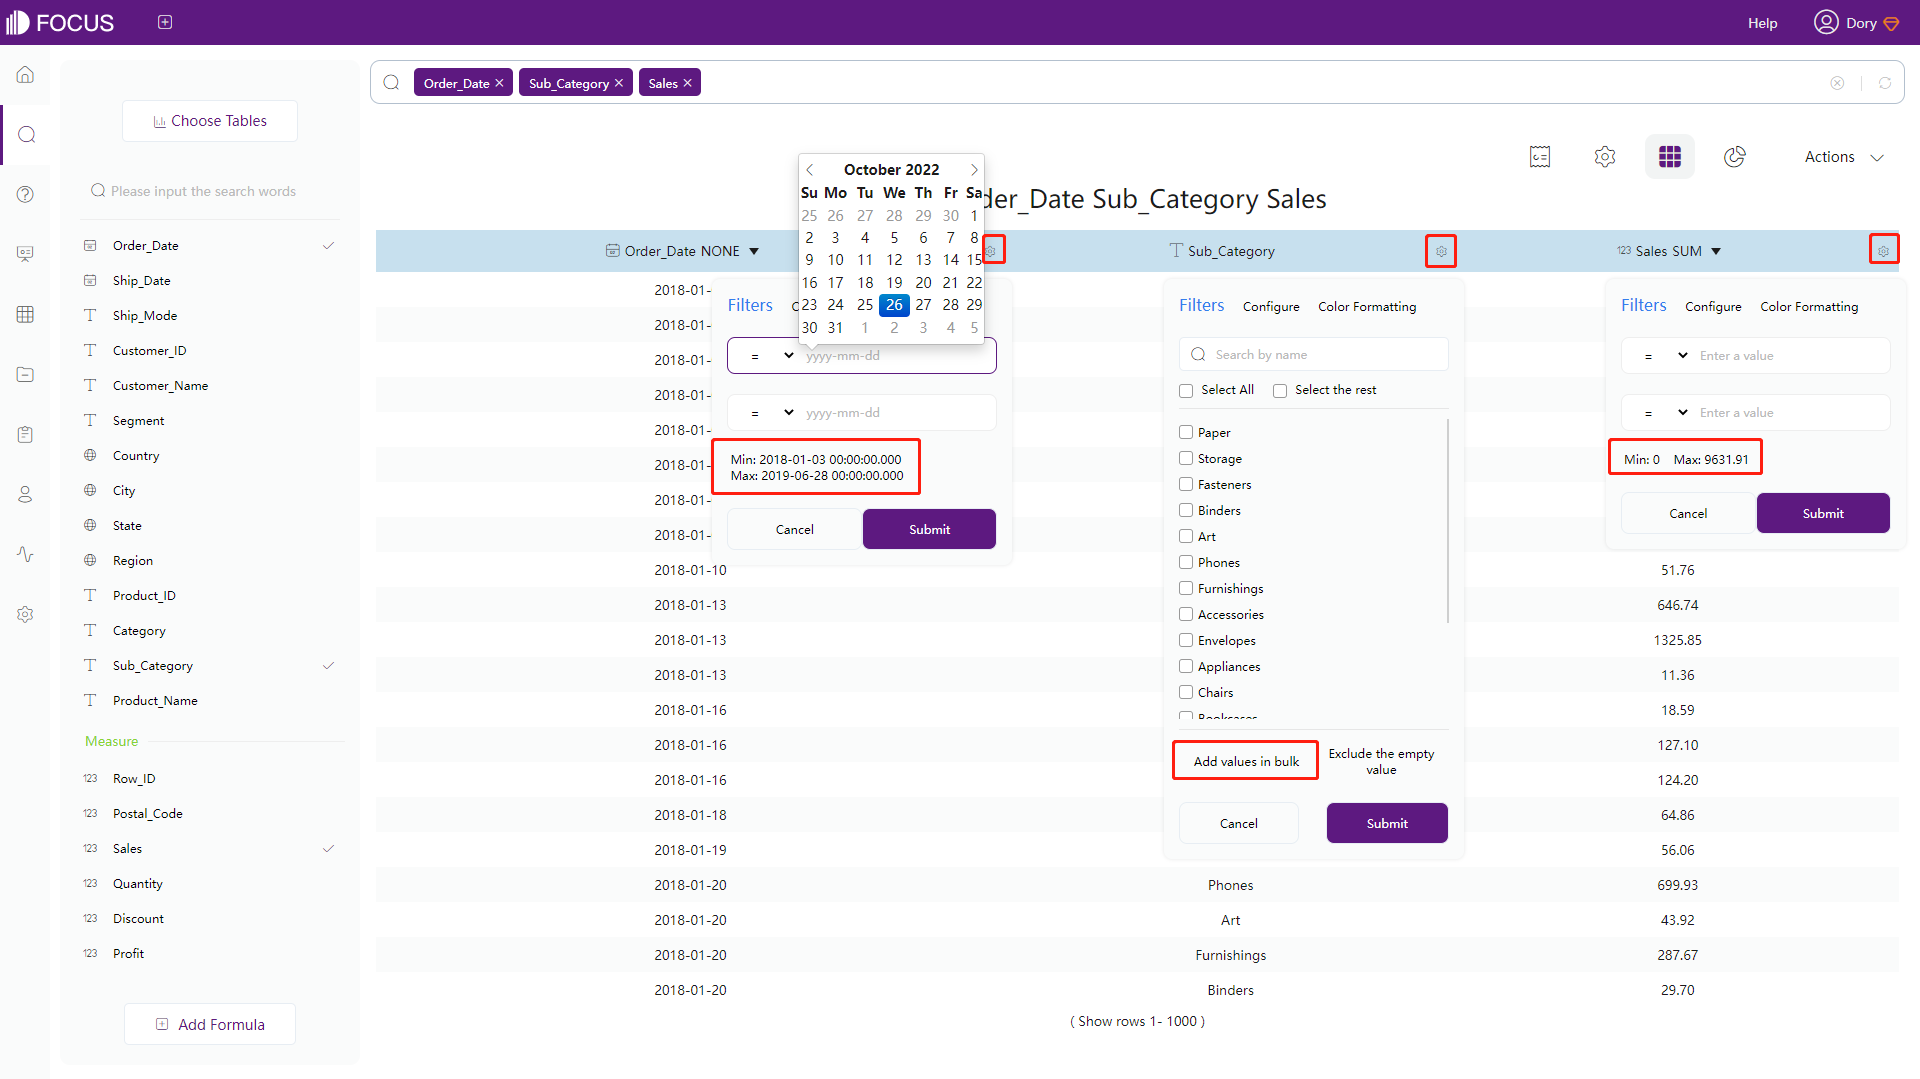
Figure 2-20 Filter types - DFC -
Answer filters
(1) Keywords
The center of search analysis is keywords. Keywords are also one type of filtering. For example, users can type “top 5 Sales” to select the 5 best-selling products.
GIF Figure 2-21 Keywords (2) Filter on tables
For grid table and pivot table, filters can be added through the settings button, as shown in figure 2-20.
(3) Filter on charts
Filters can be added to chart though axes, as shown below.
GIF Figure 2-22 Filter - graphics -
Dashboard filters
Filter components would display within the dashboard if users choose to add them. As shown below, various filter component types can be found under “Text” component.
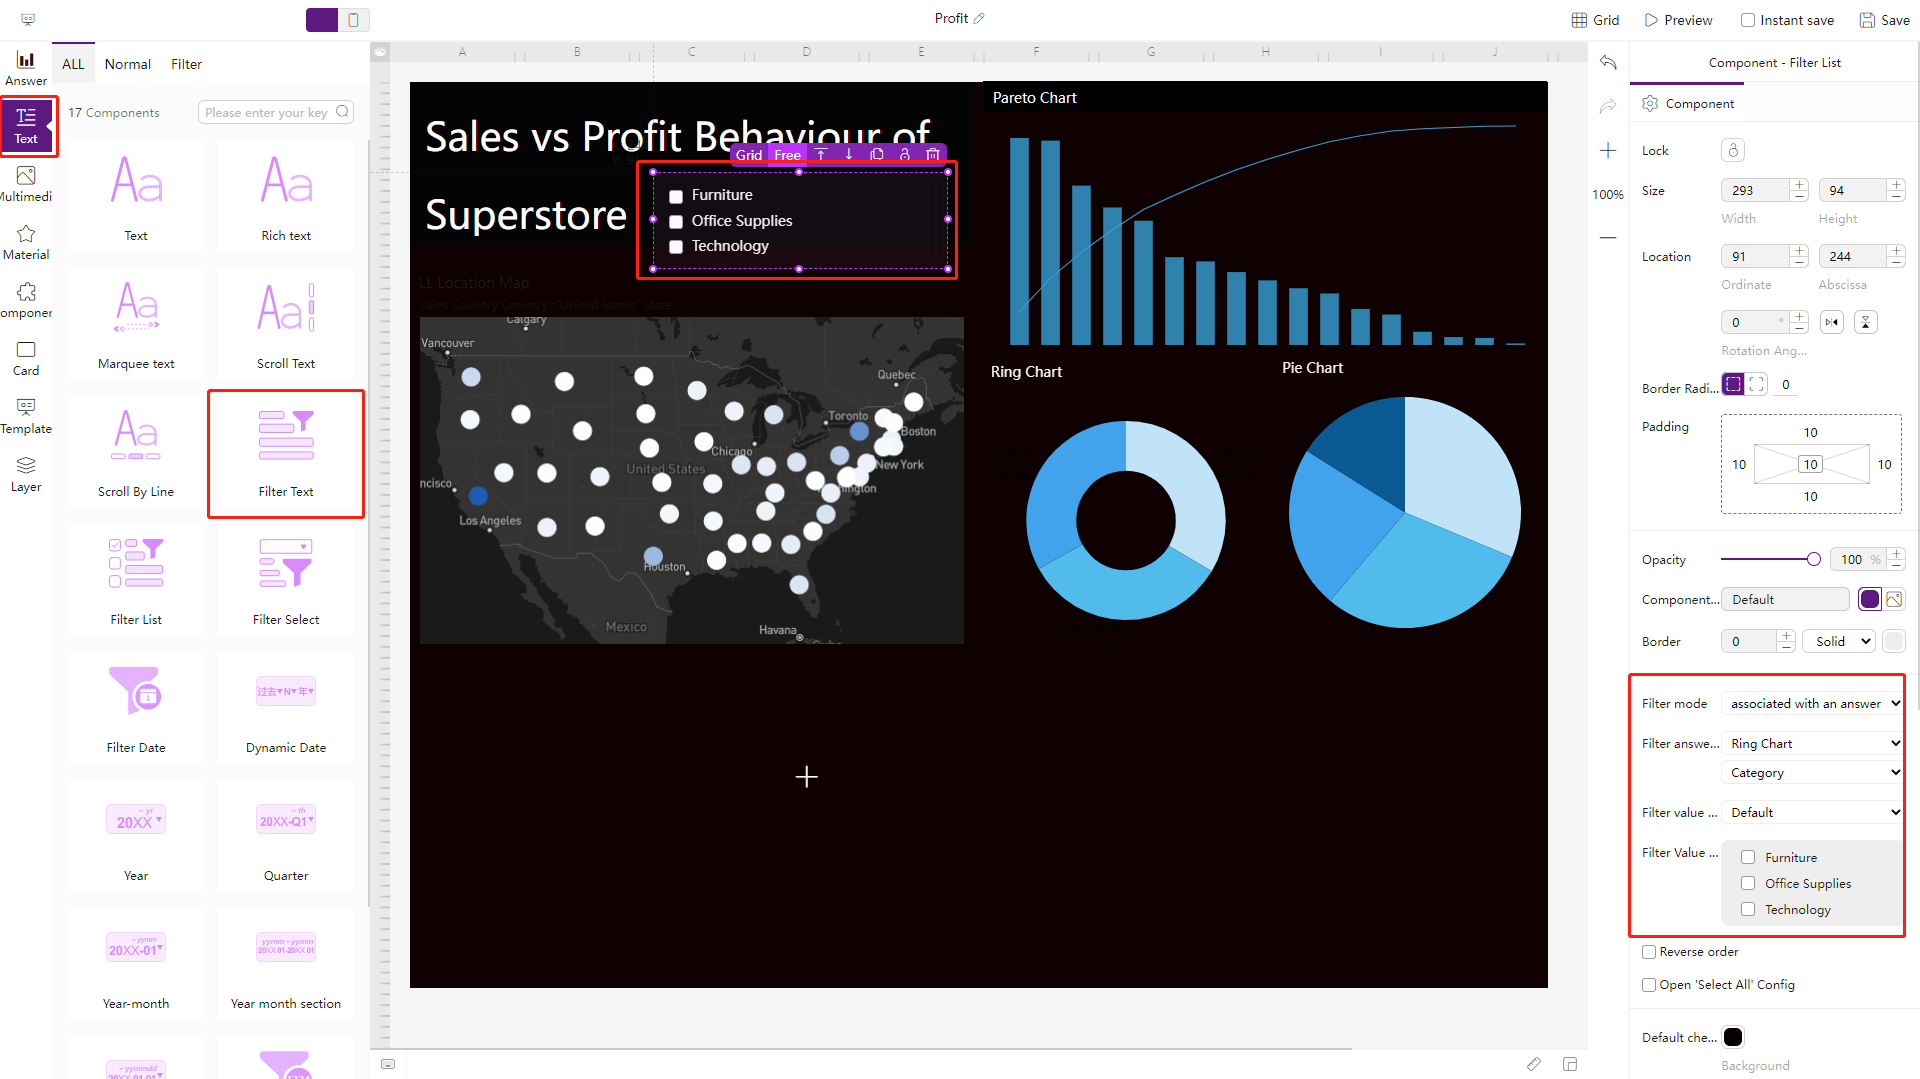
Figure 2-23 Filter components
2.3.3 Formula
Formula editors are compared here.
| Aspects | Tibco Cloud Spotfire | DataFocus Cloud |
|---|---|---|
| Formula Types | Conversion, cast, ranking, spatial, statistical, text, … | Aggregation, analyze, conversion, date, string, JSON, … |
| Prompt | Functionnames,column names | Function names, column names, syntax |
| Description&E.gs | Suspend | Assistance on the side |
| Validation | Error prompt | Automatically |
-
Formula types
Both tools provide various types of formulas, Tibco Cloud Spotfire has some statistical and spatial formulas, while DFC has some analyze and JSON formulas.
-
Prompt
As shown in gif figure 2-24, Tibco Cloud Spotfire would prompt the formula names and the column names.
GIF Figure 2-24 Prompt - Tibco Apart from formula names as well as column names, DFC also prompts syntax to help users quickly build formulas.
GIF Figure 2-25 Prompt - DFC -
Description & Examples
Both platforms provide assistance such as description and examples.
The difference is that description window in Tibco Cloud Spotfire is suspended and would not stay, and there is a formula assistant in DFC that would stay on the right side of the formula editor to keep providing information.
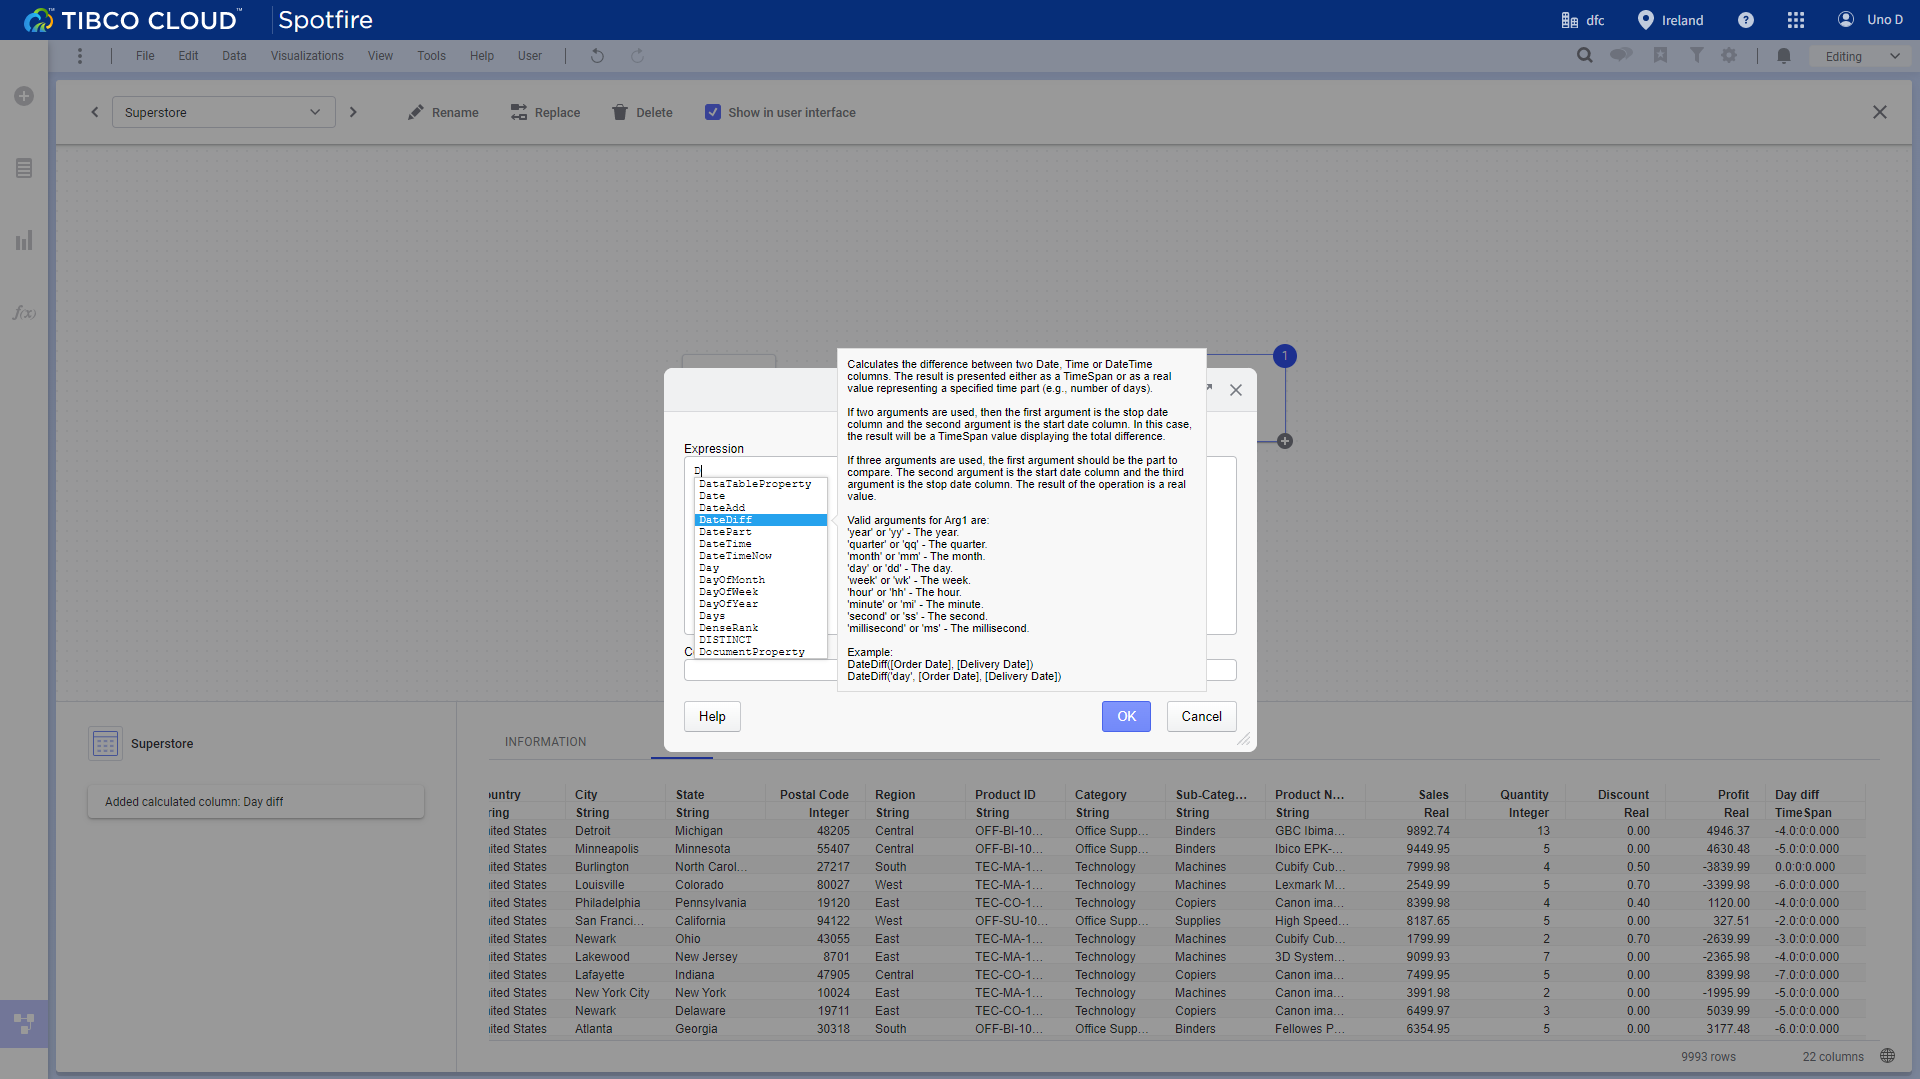
Figure 2-26 Description window - Tibco Cloud Spotfire 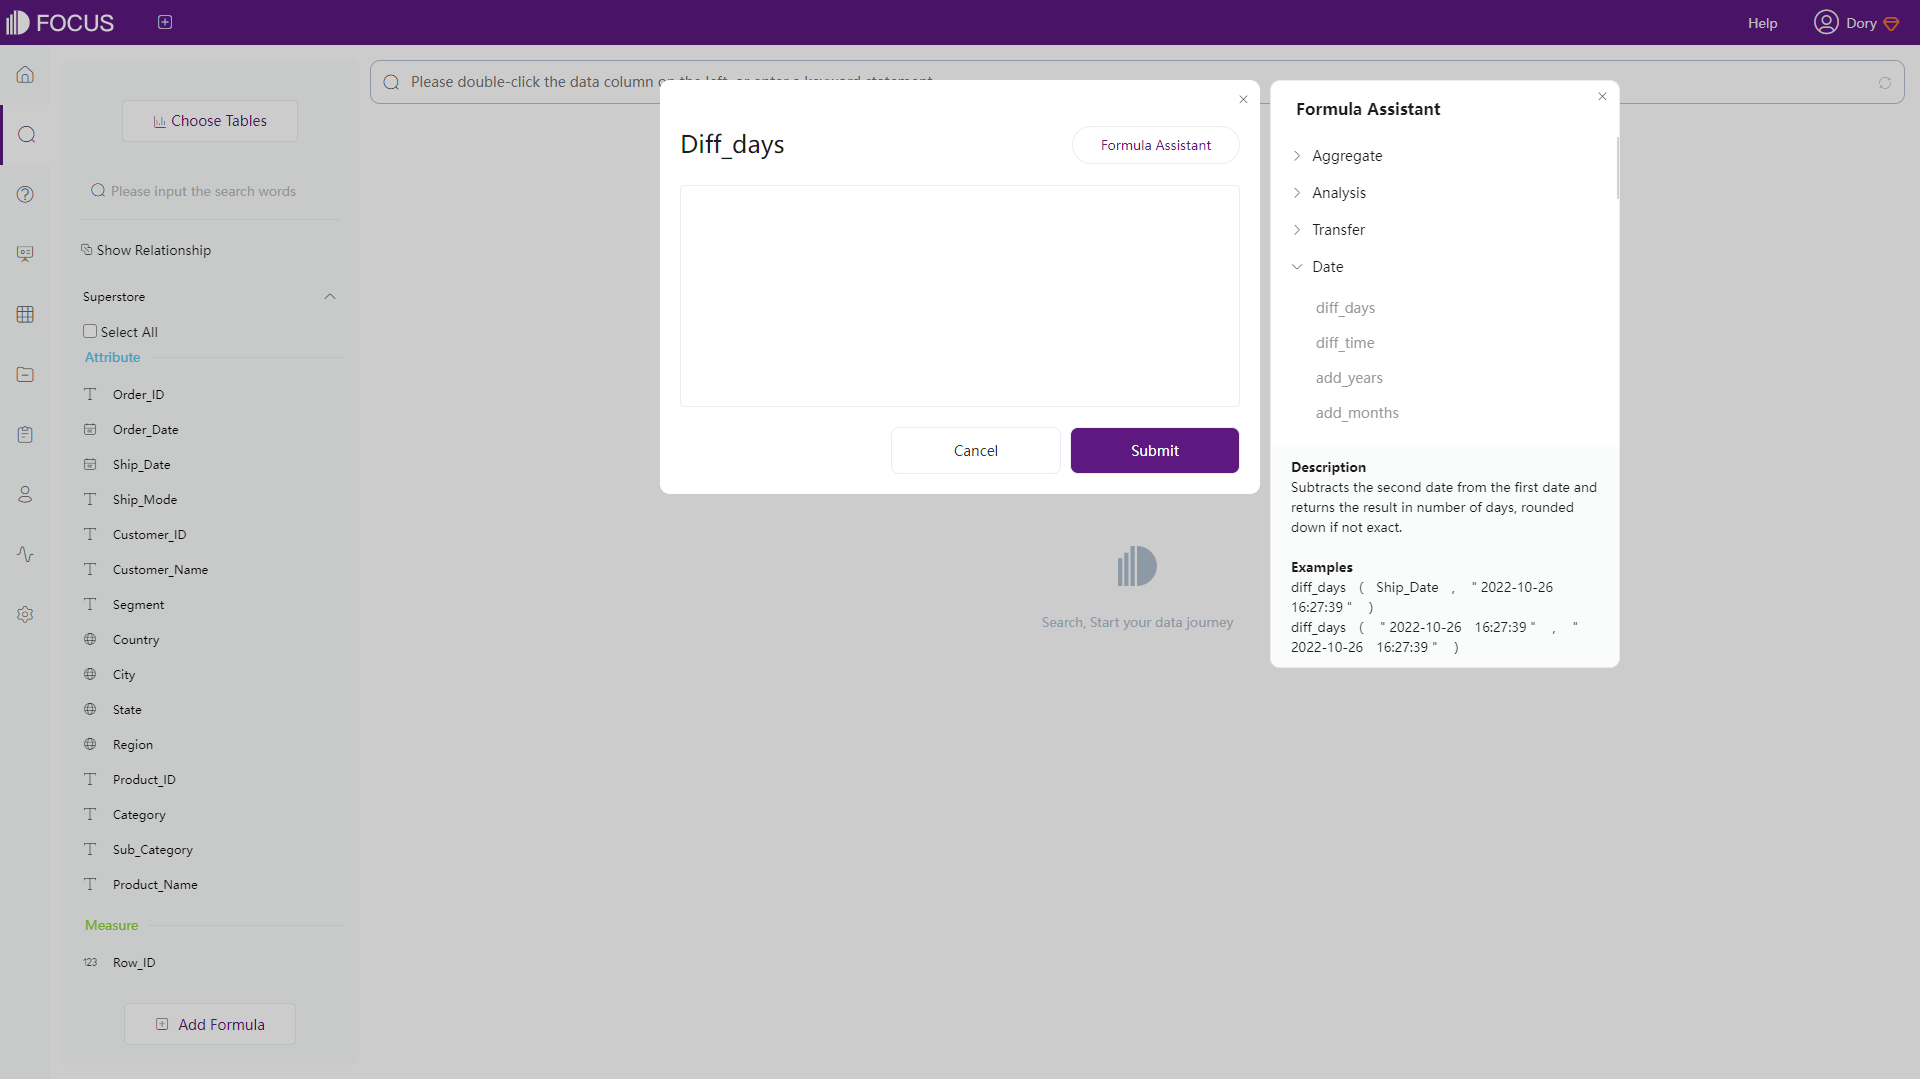
Figure 2-27 Description window - DFC -
Validation
Click “OK”, and if the formula is not appropriate, then there would be an error message on the window in Tibco Cloud Spotfire. While formulas are validated automatically and in real-time in DFC, as shown below.
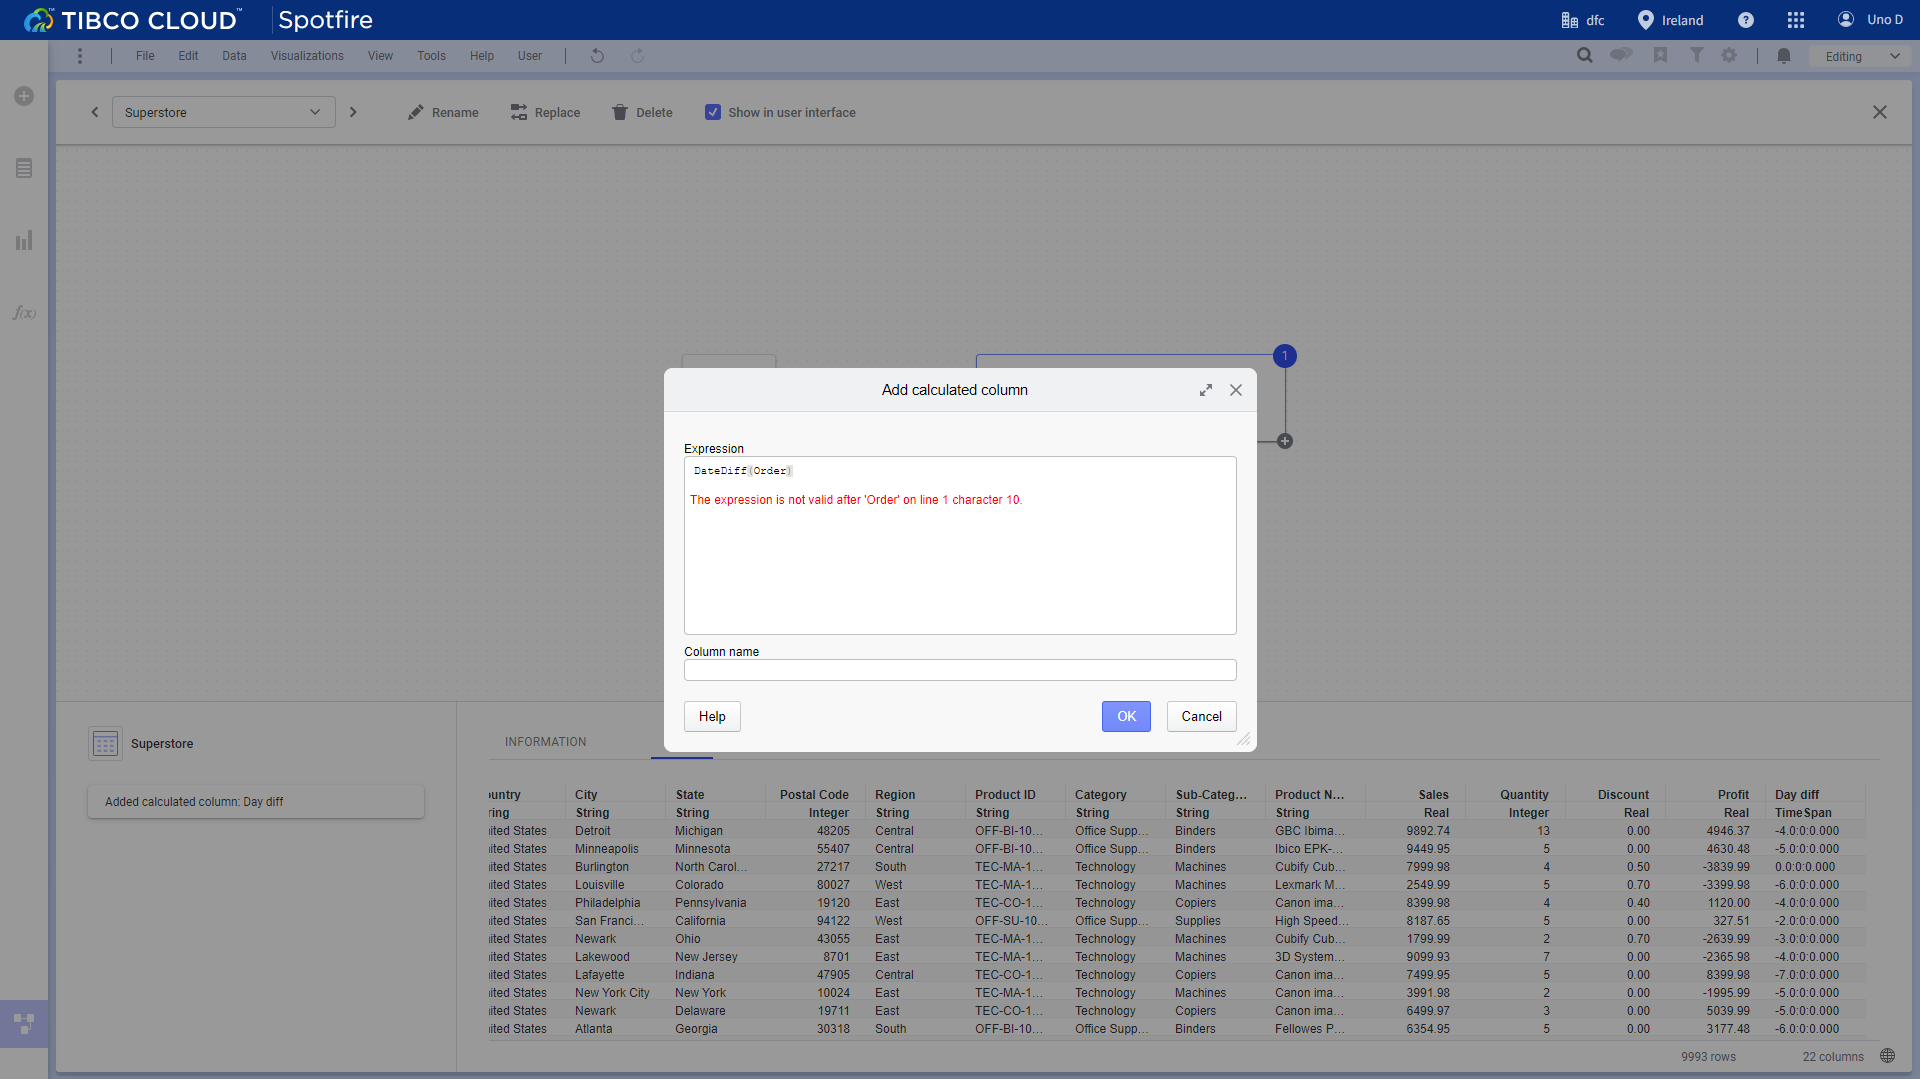
Figure 2-28 Validation - Tibco Cloud Spotfire 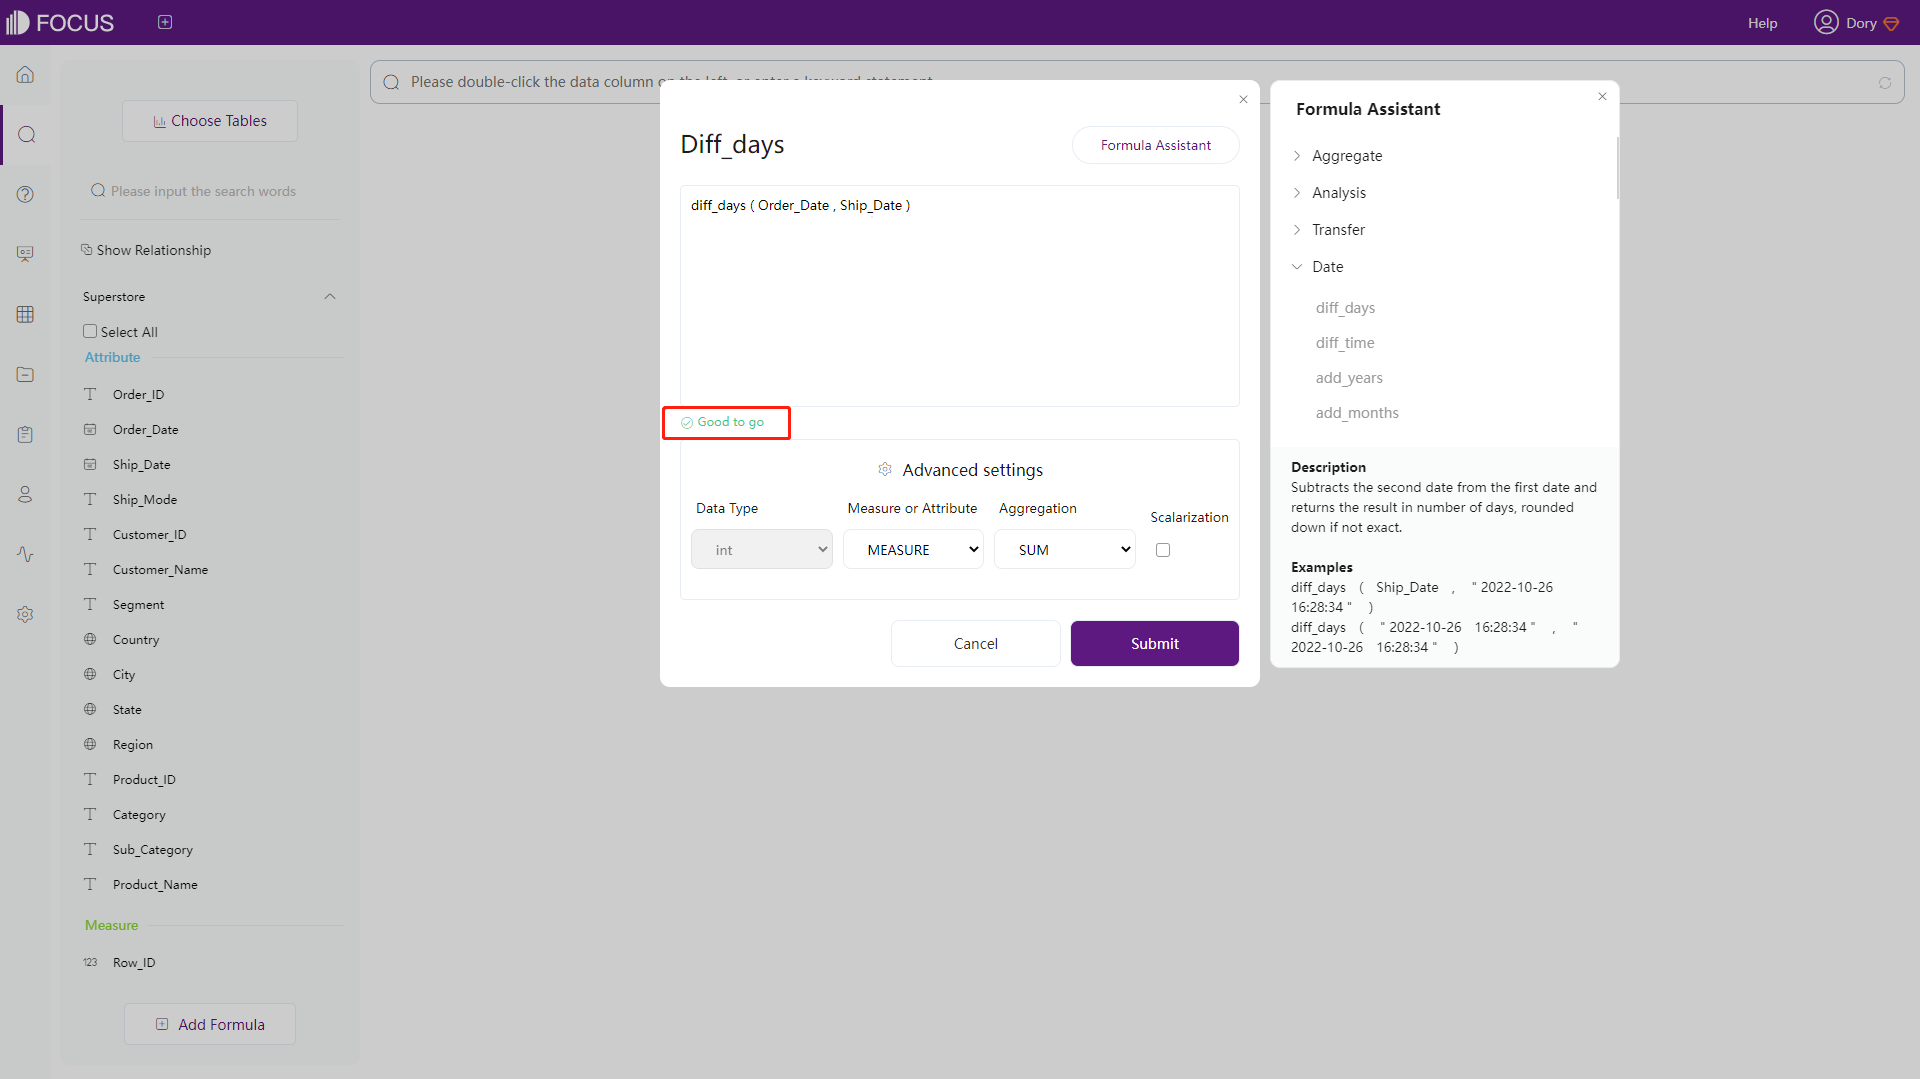
Figure 2-29 Validation - DFC
2.4 Data Processing
-
Add Rows
Tibco Cloud Spotfire:
Rows can be added when add new data through the “Files and data” flyout or on the “Data canvas”. Below is the example of “Data canvas”.
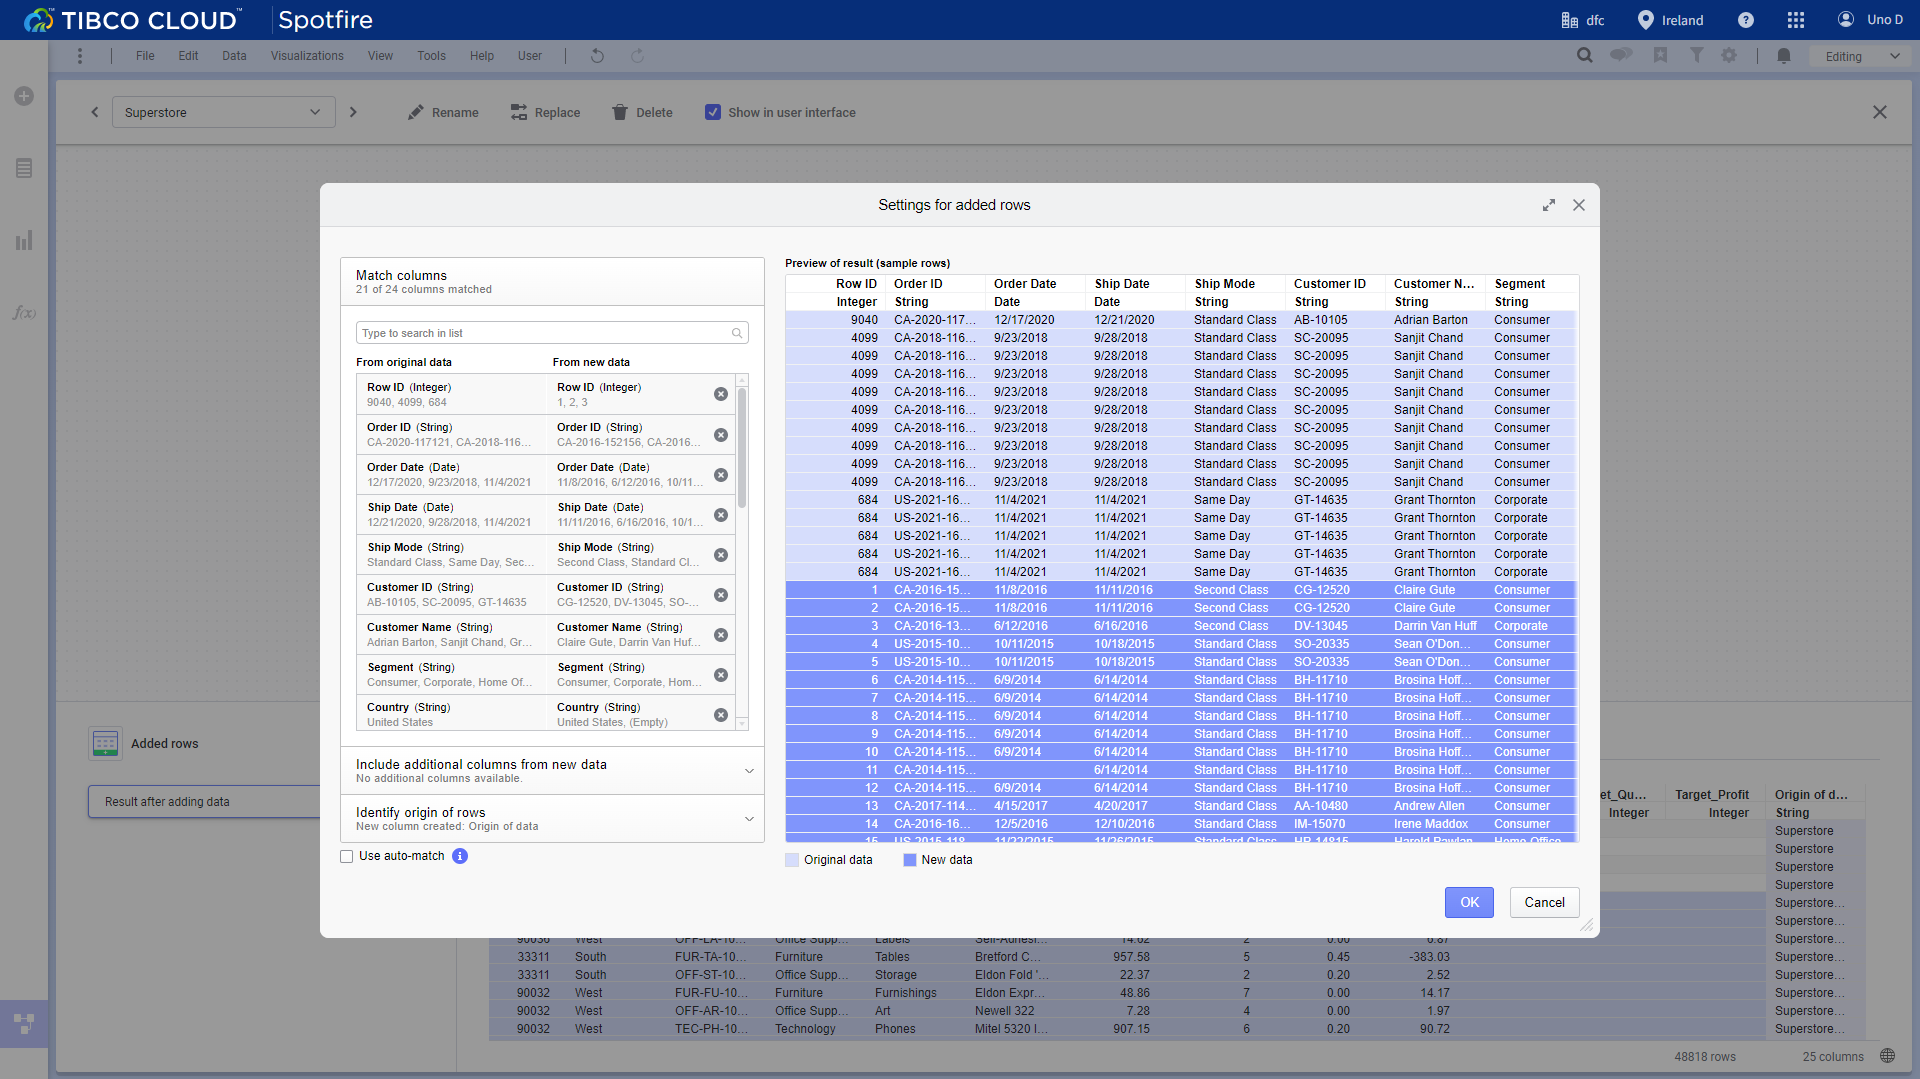
Figure 2-30 Add rows - Tibco Cloud Spotfire DataFocus Cloud:
On the detailed data table page, users can either append new data or overlay the entire data table, as shown below.
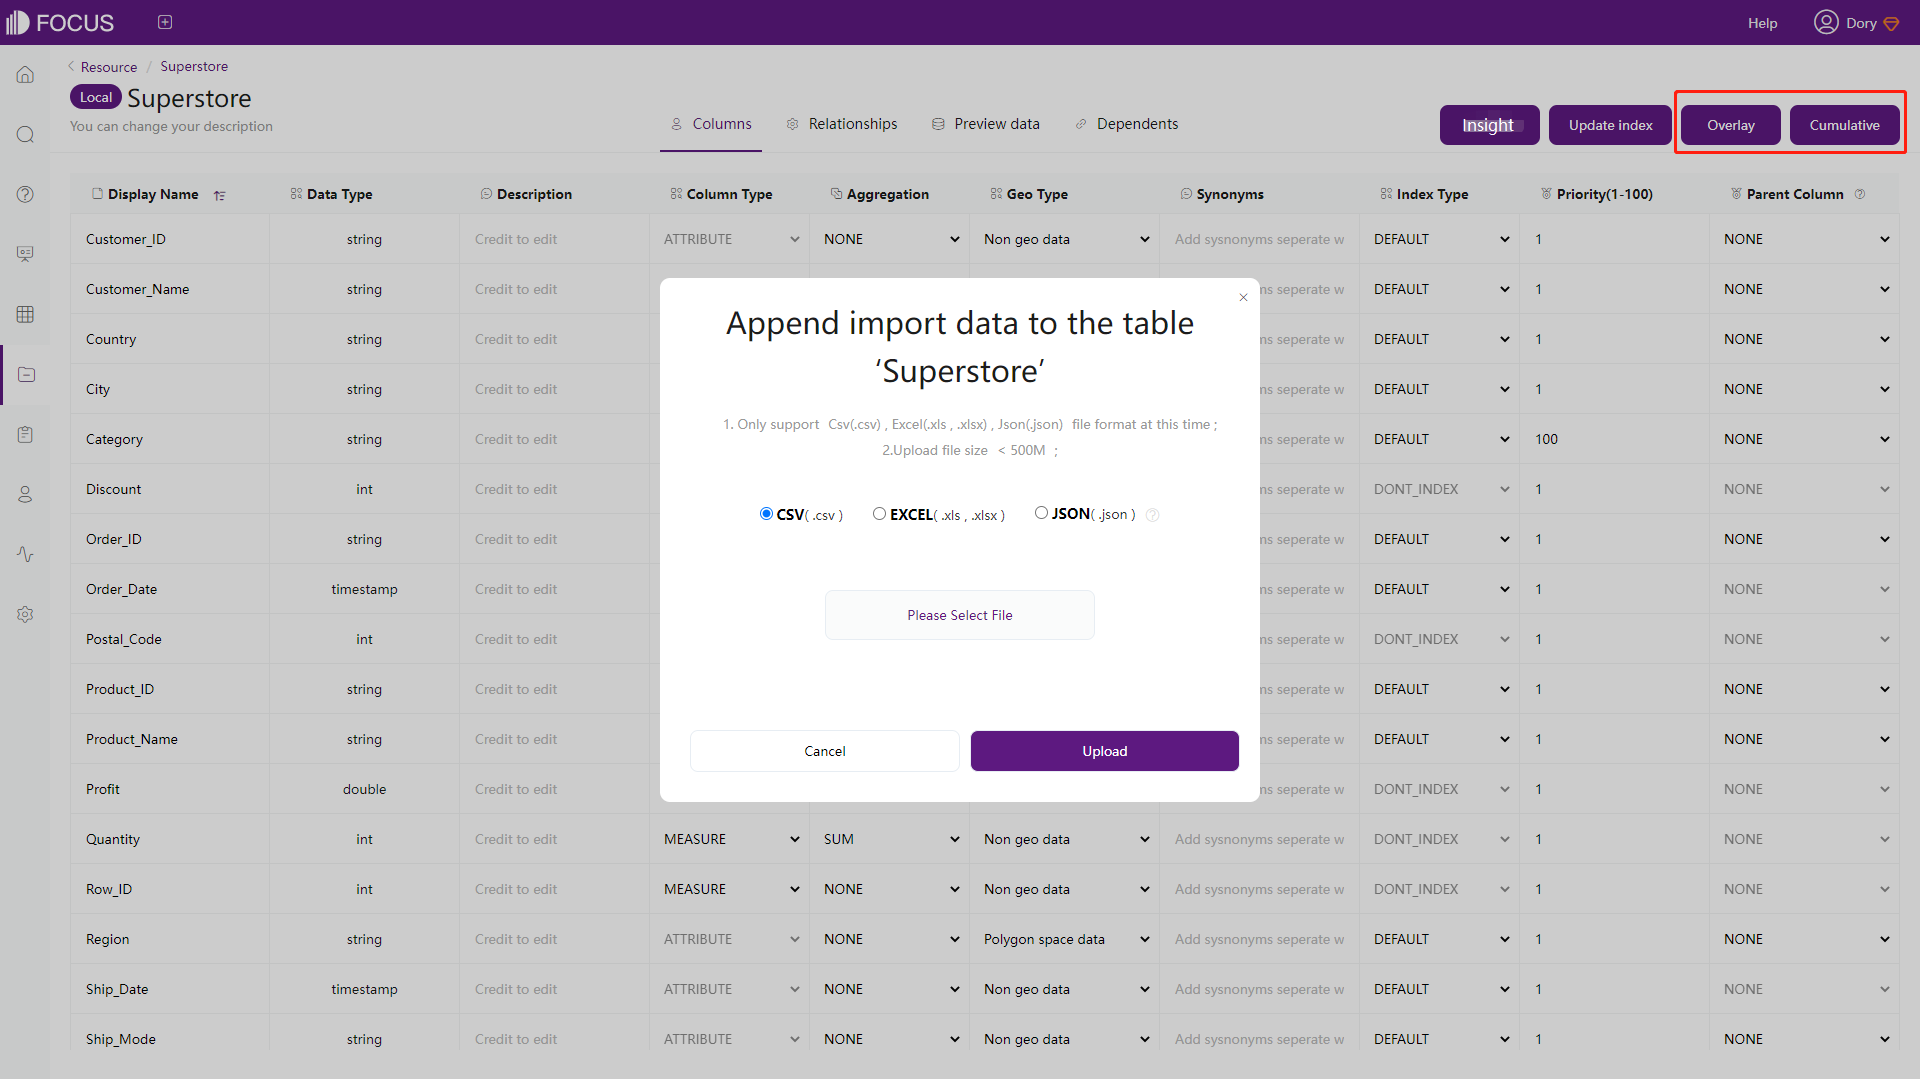
Figure 2-31 Add rows - DFC -
Add Columns
To add column values, tables need to be related first, both Tibco Cloud Spotfire and DFC provide several join types. What’ more, DFC also supported adding filters on the join, as shown below.
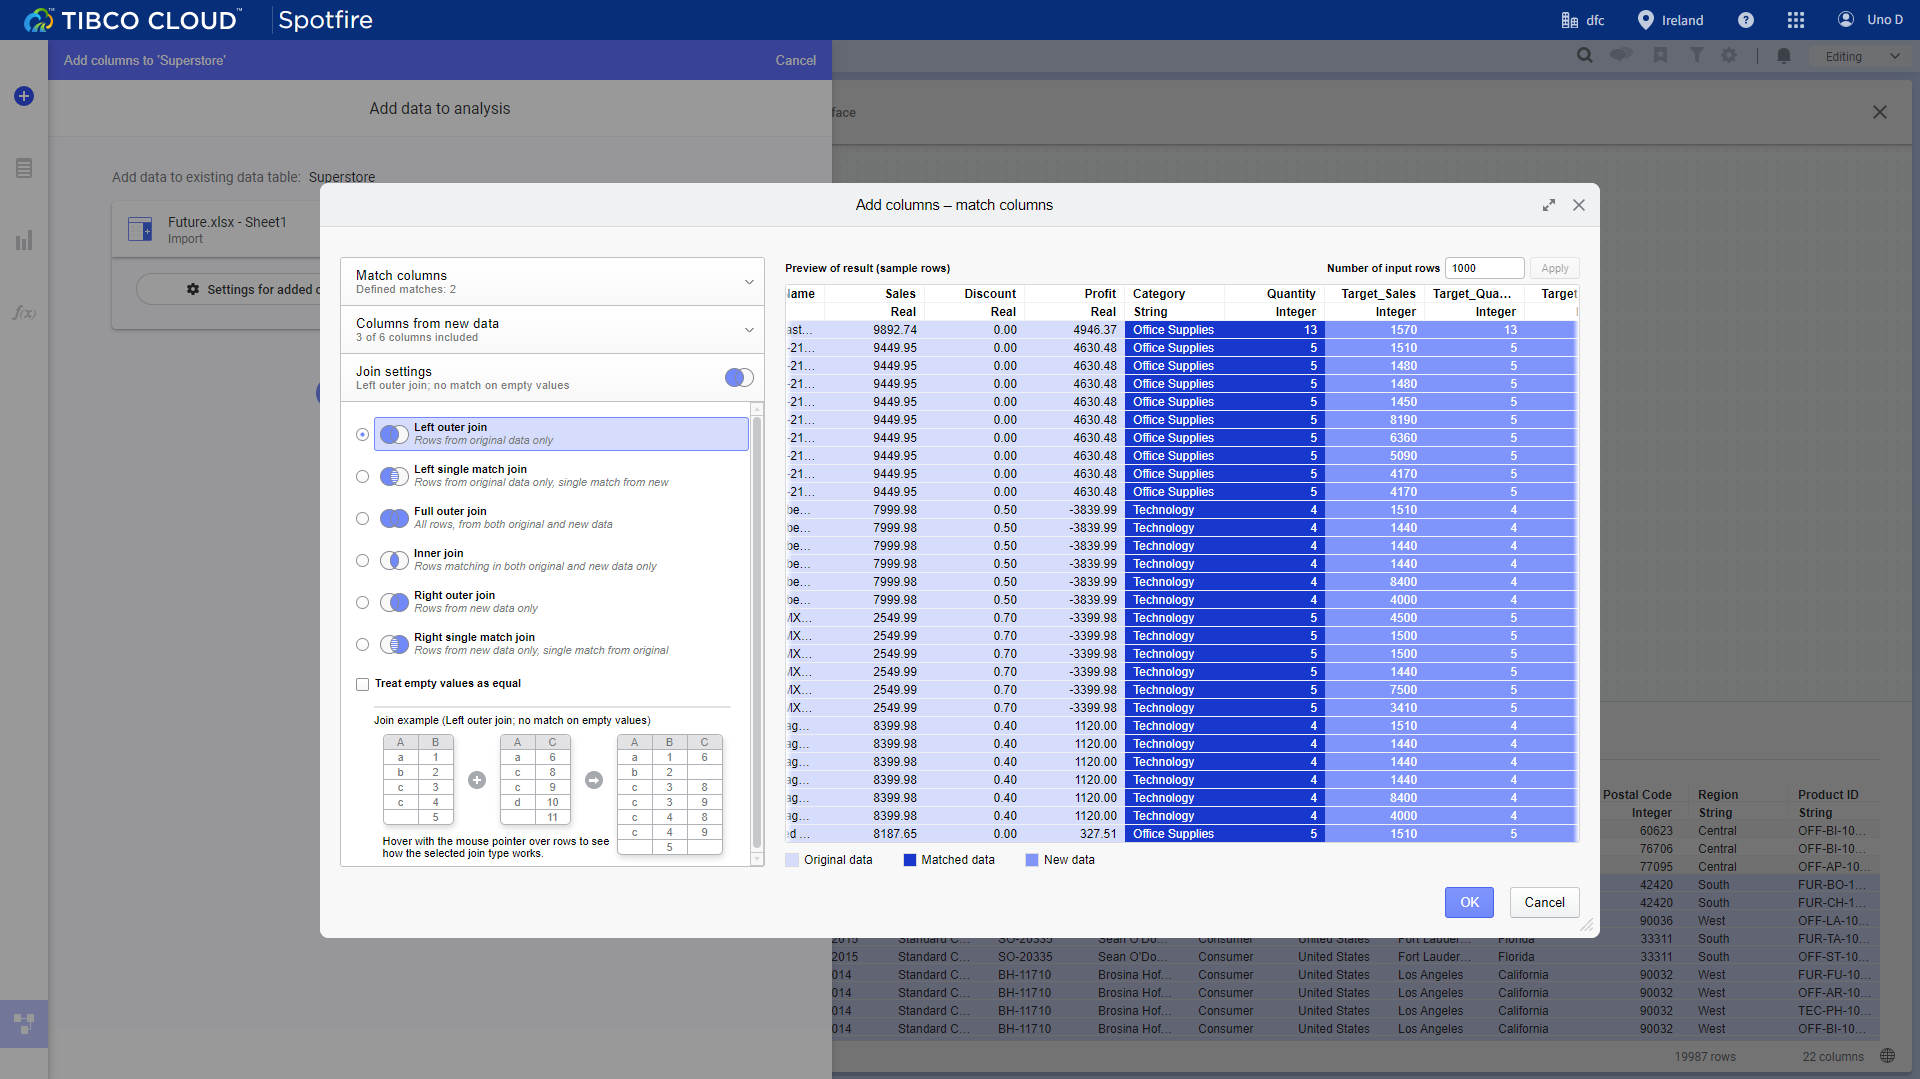
Figure 2-32 Add columns - Tibco Cloud Spotfire 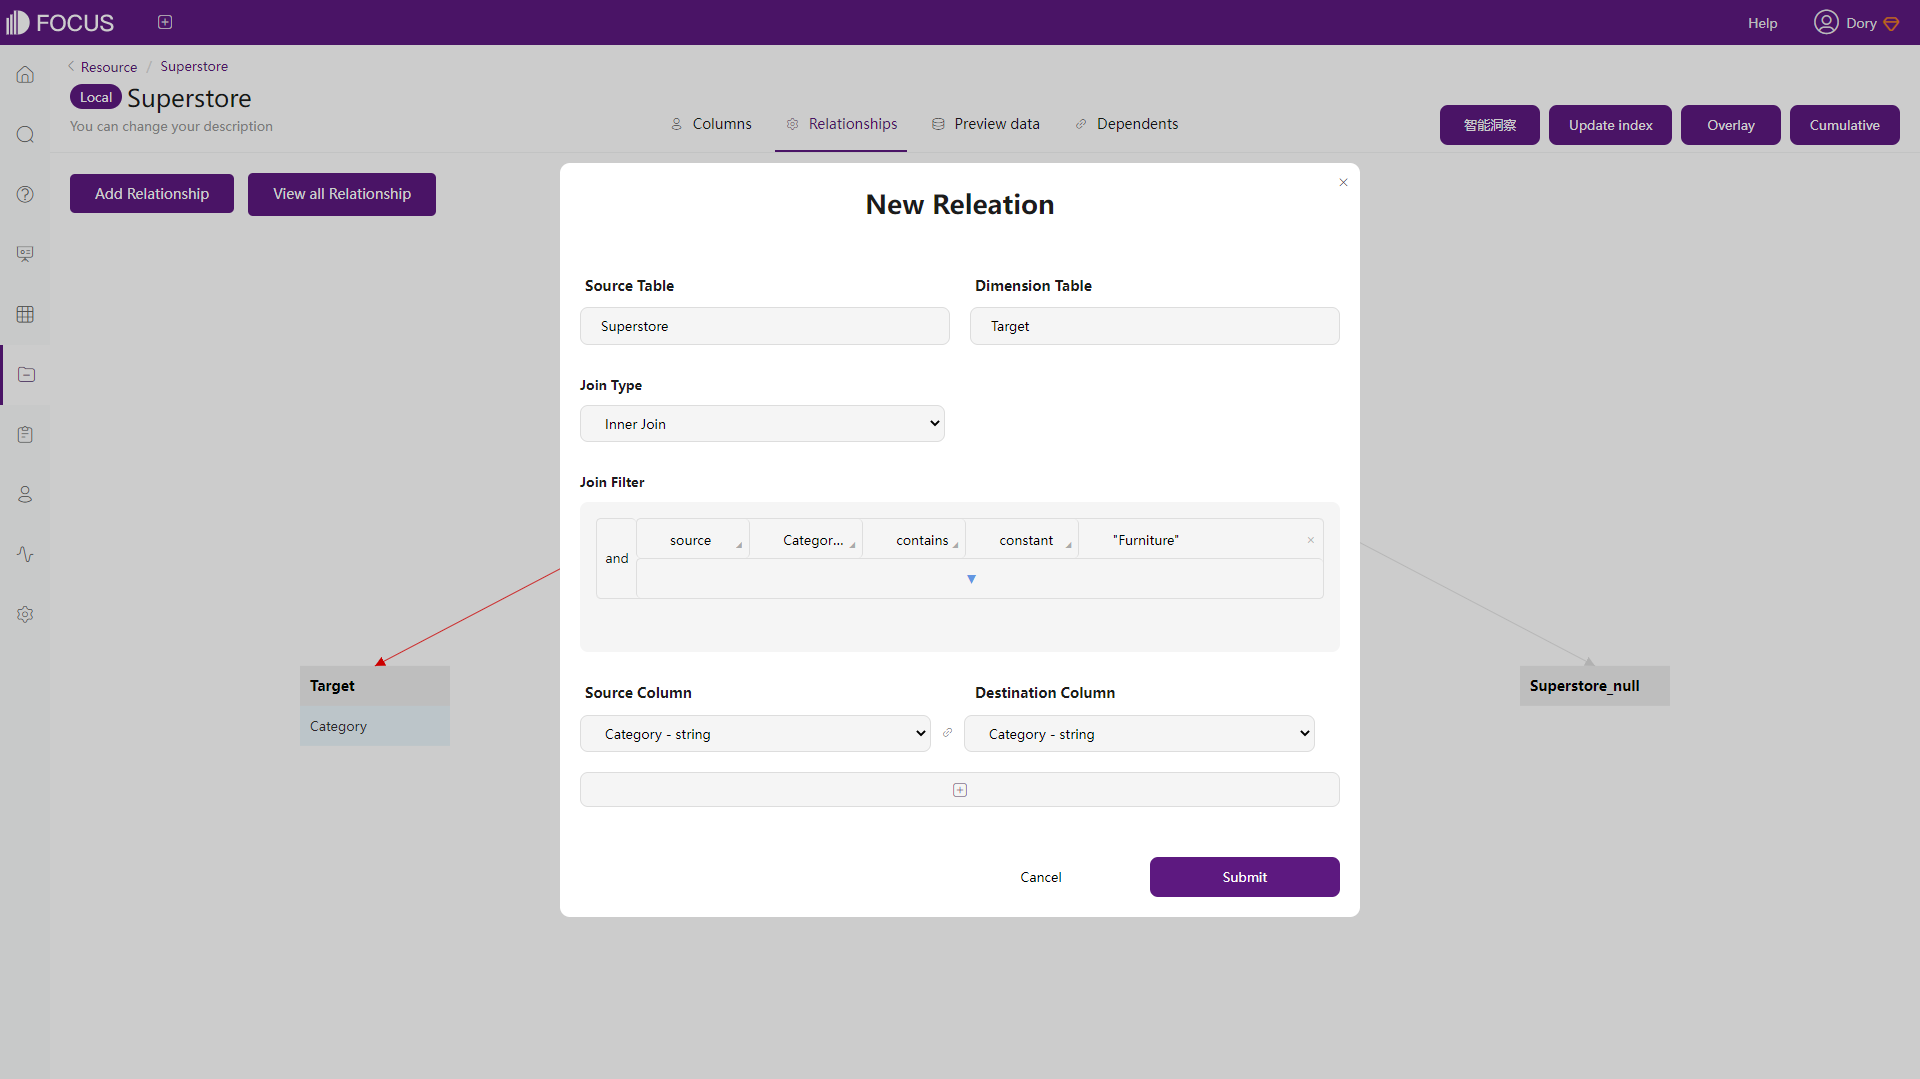
Figure 2-33 Add columns - DFC -
Conversion between Rows & Columns
Tibco Cloud Spotfire:
“Unpivot” function can combine columns with similar values into a single column. However, when it comes to relevantly complicated data structures, unpivot may not satisfy users’ needs.
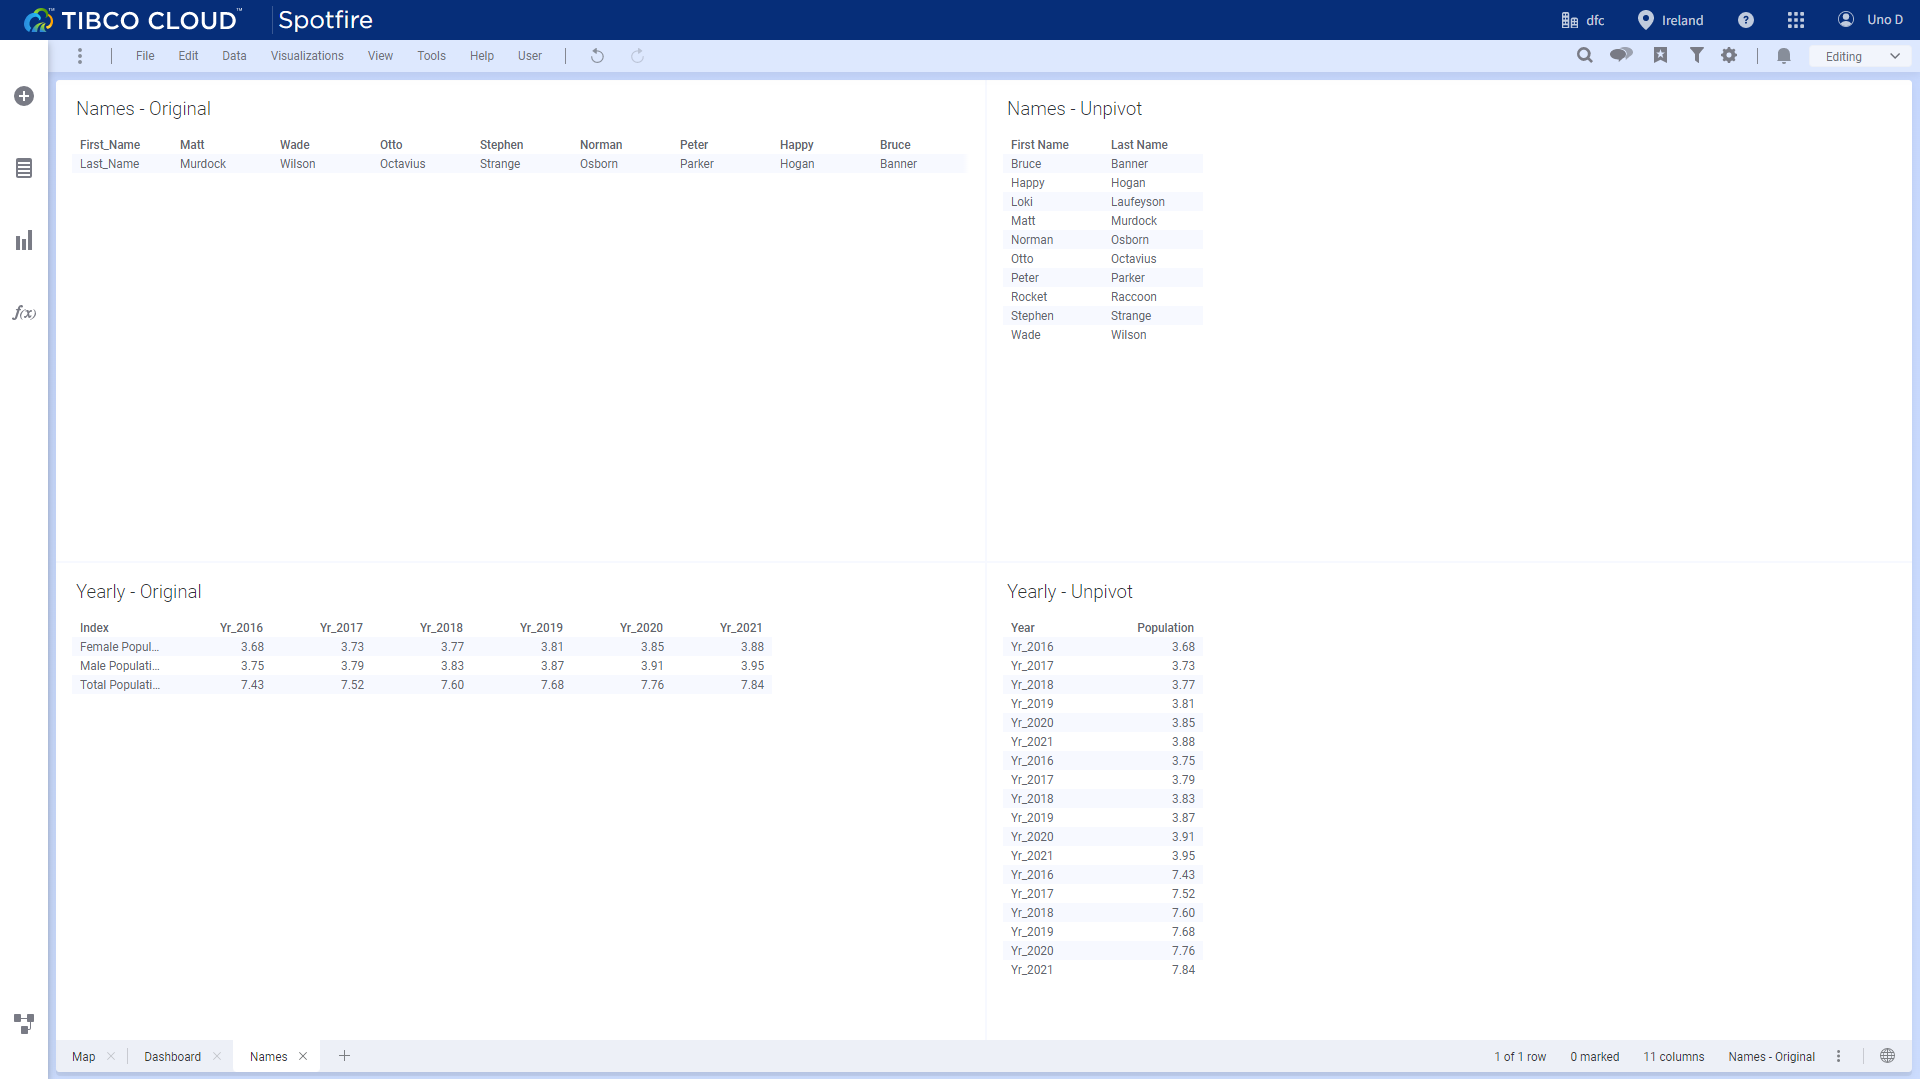
Figure 2-34 Unpivot - Tibco Cloud Spotfire DataFocus Cloud:
Rows and columns can be converted freely in DFC, even with complicated data structure.
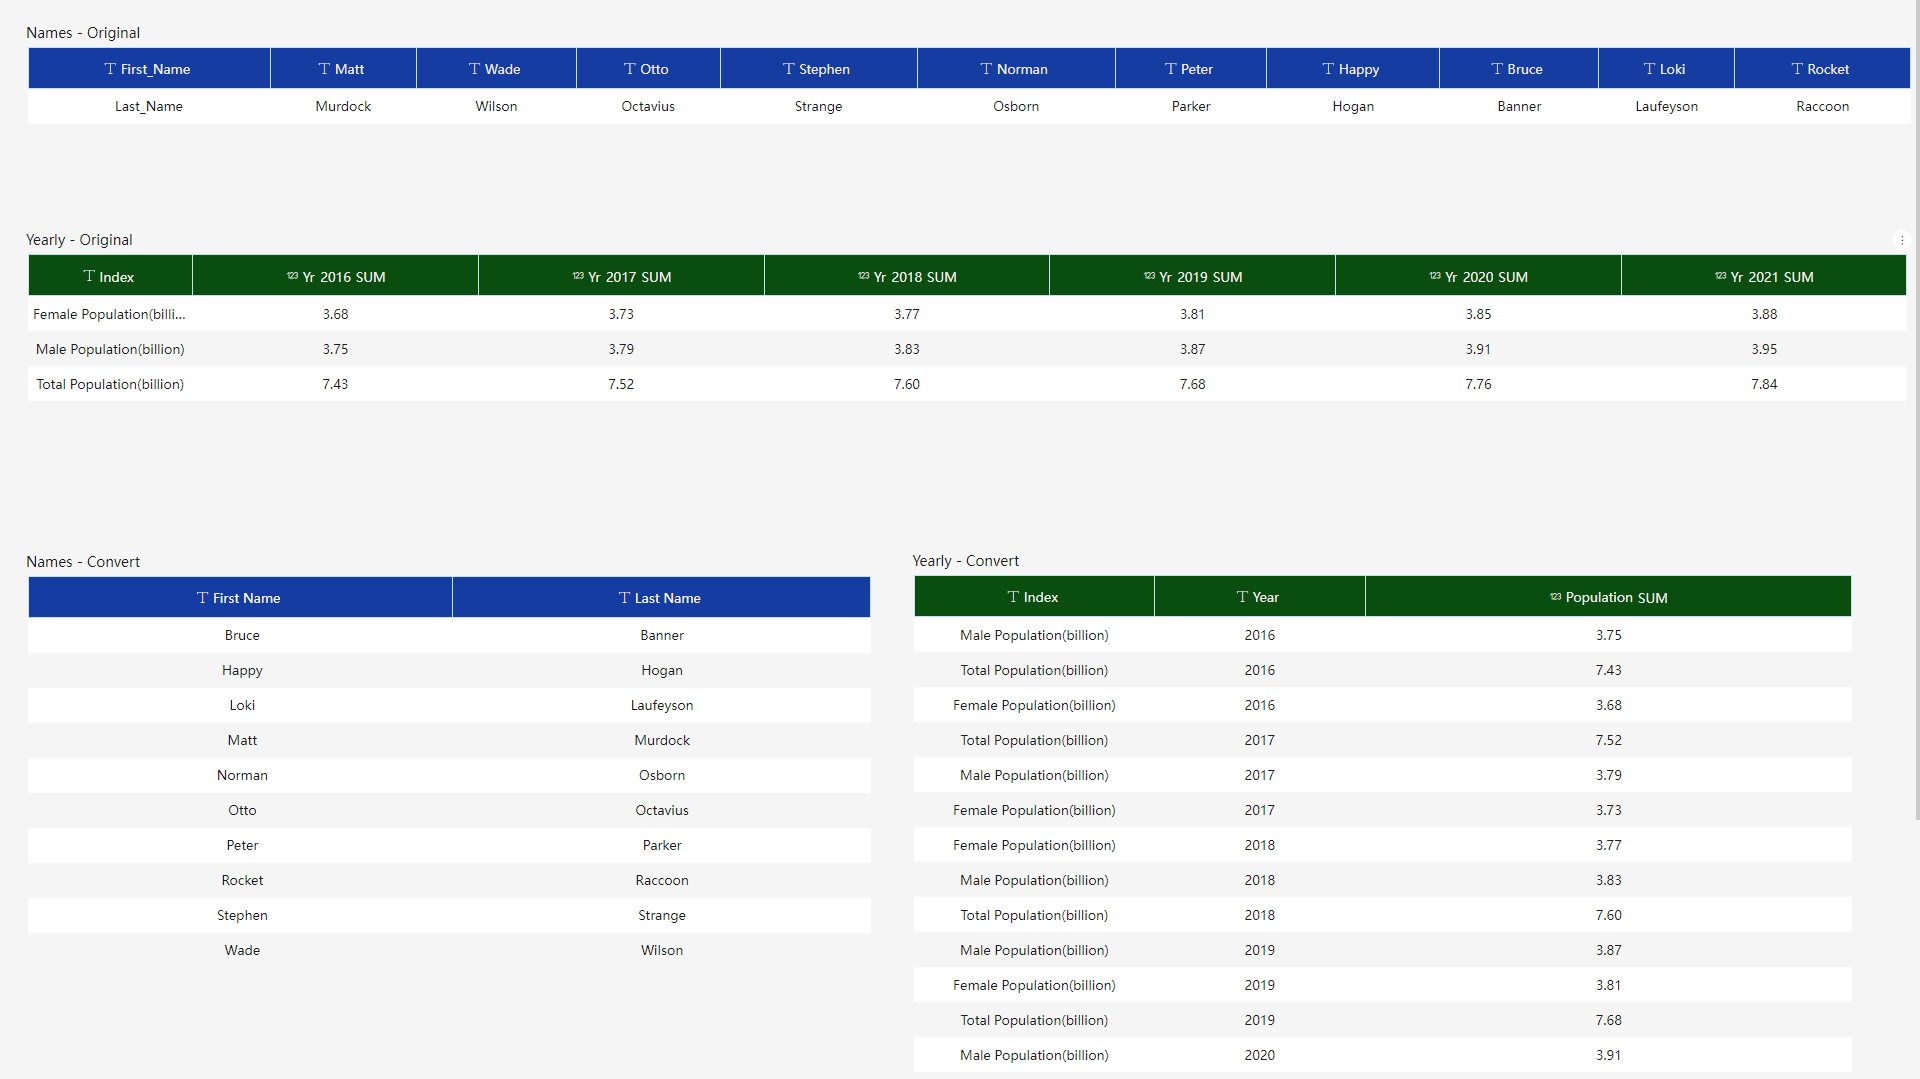
Figure 2-35 Convert rows&columns - DFC -
Split Columns
Tibco Cloud Spotfire:
Users can split columns through the “Data in analysis” flyout. As shown in figure 2-36, separator, number of columns, etc. can be selected, and there is preview.
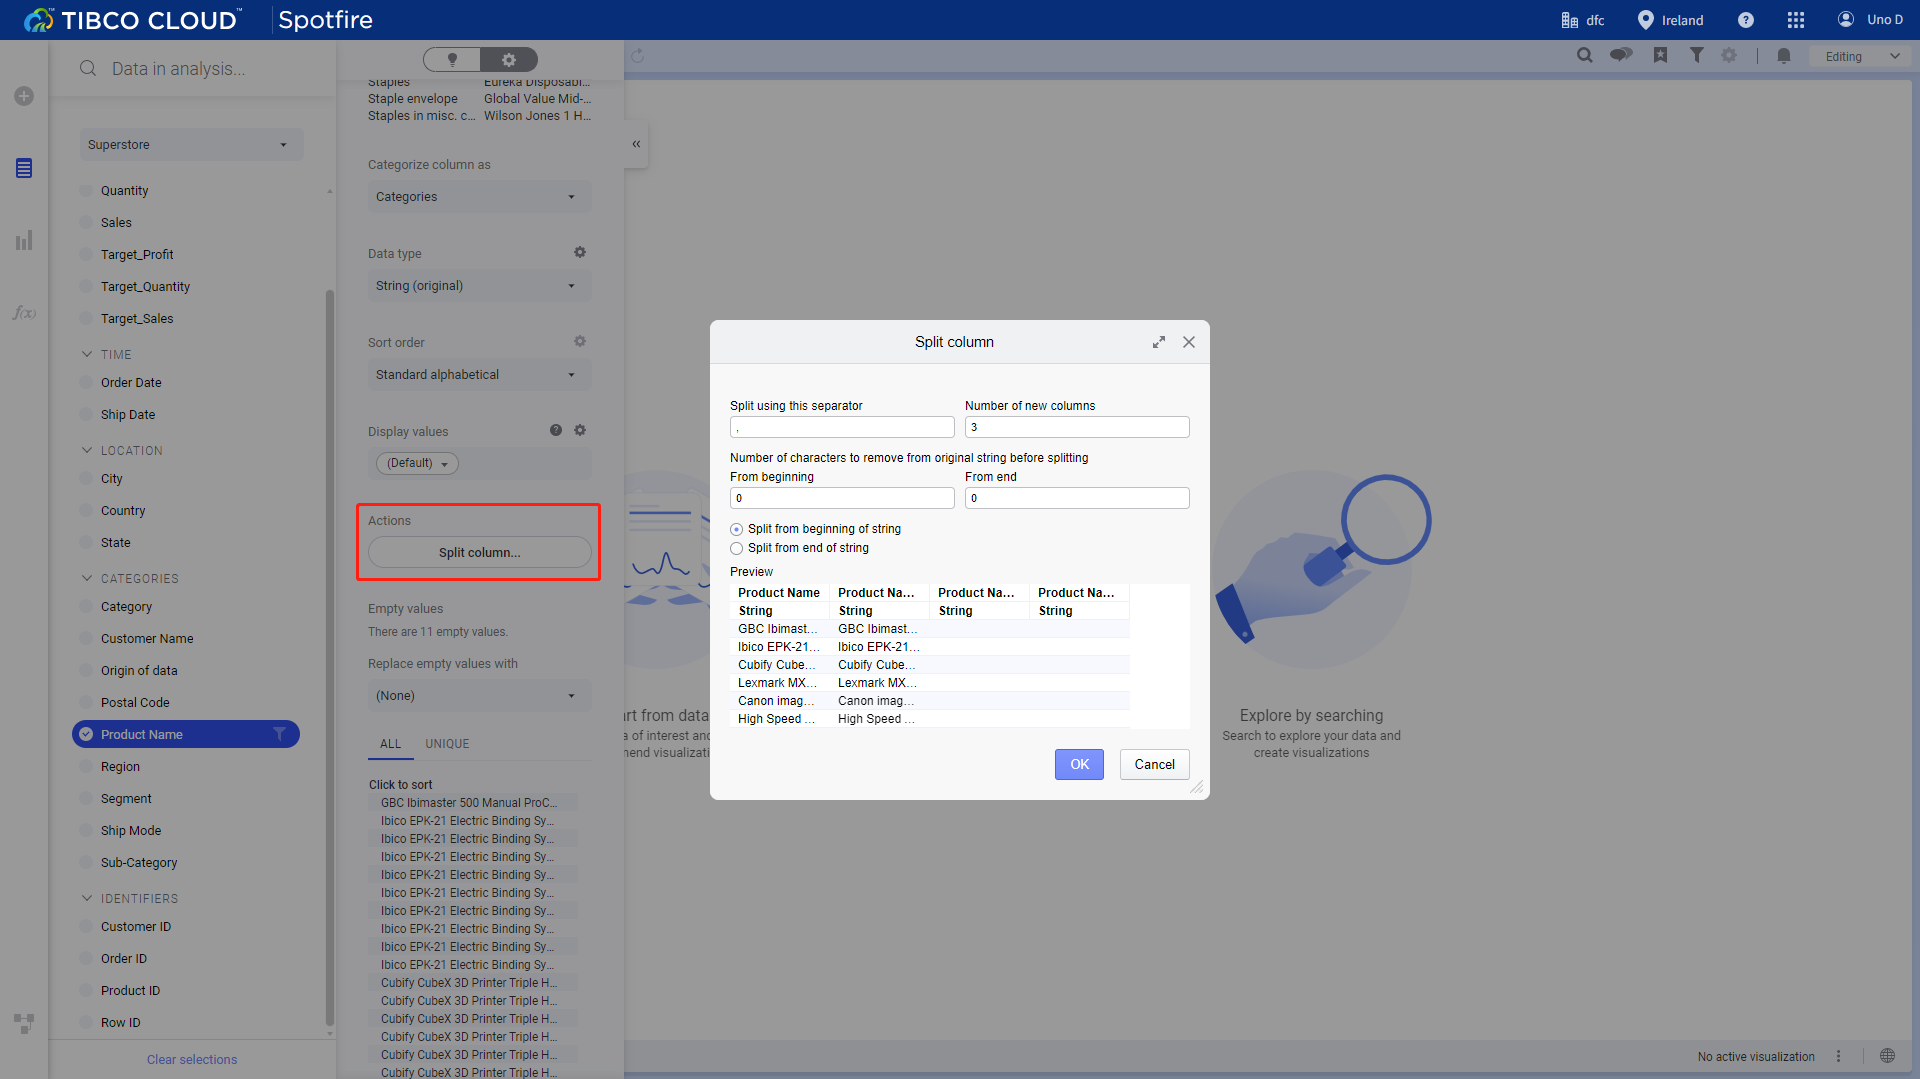
Figure 2-36 Split columns- Tibco Cloud Spotfire DataFocus Cloud:
Users can split columns from the “Data Transfer” under the “Actions” button. As shown below, split number and delimiter can be chosen, and there can be multiple split delimiter.
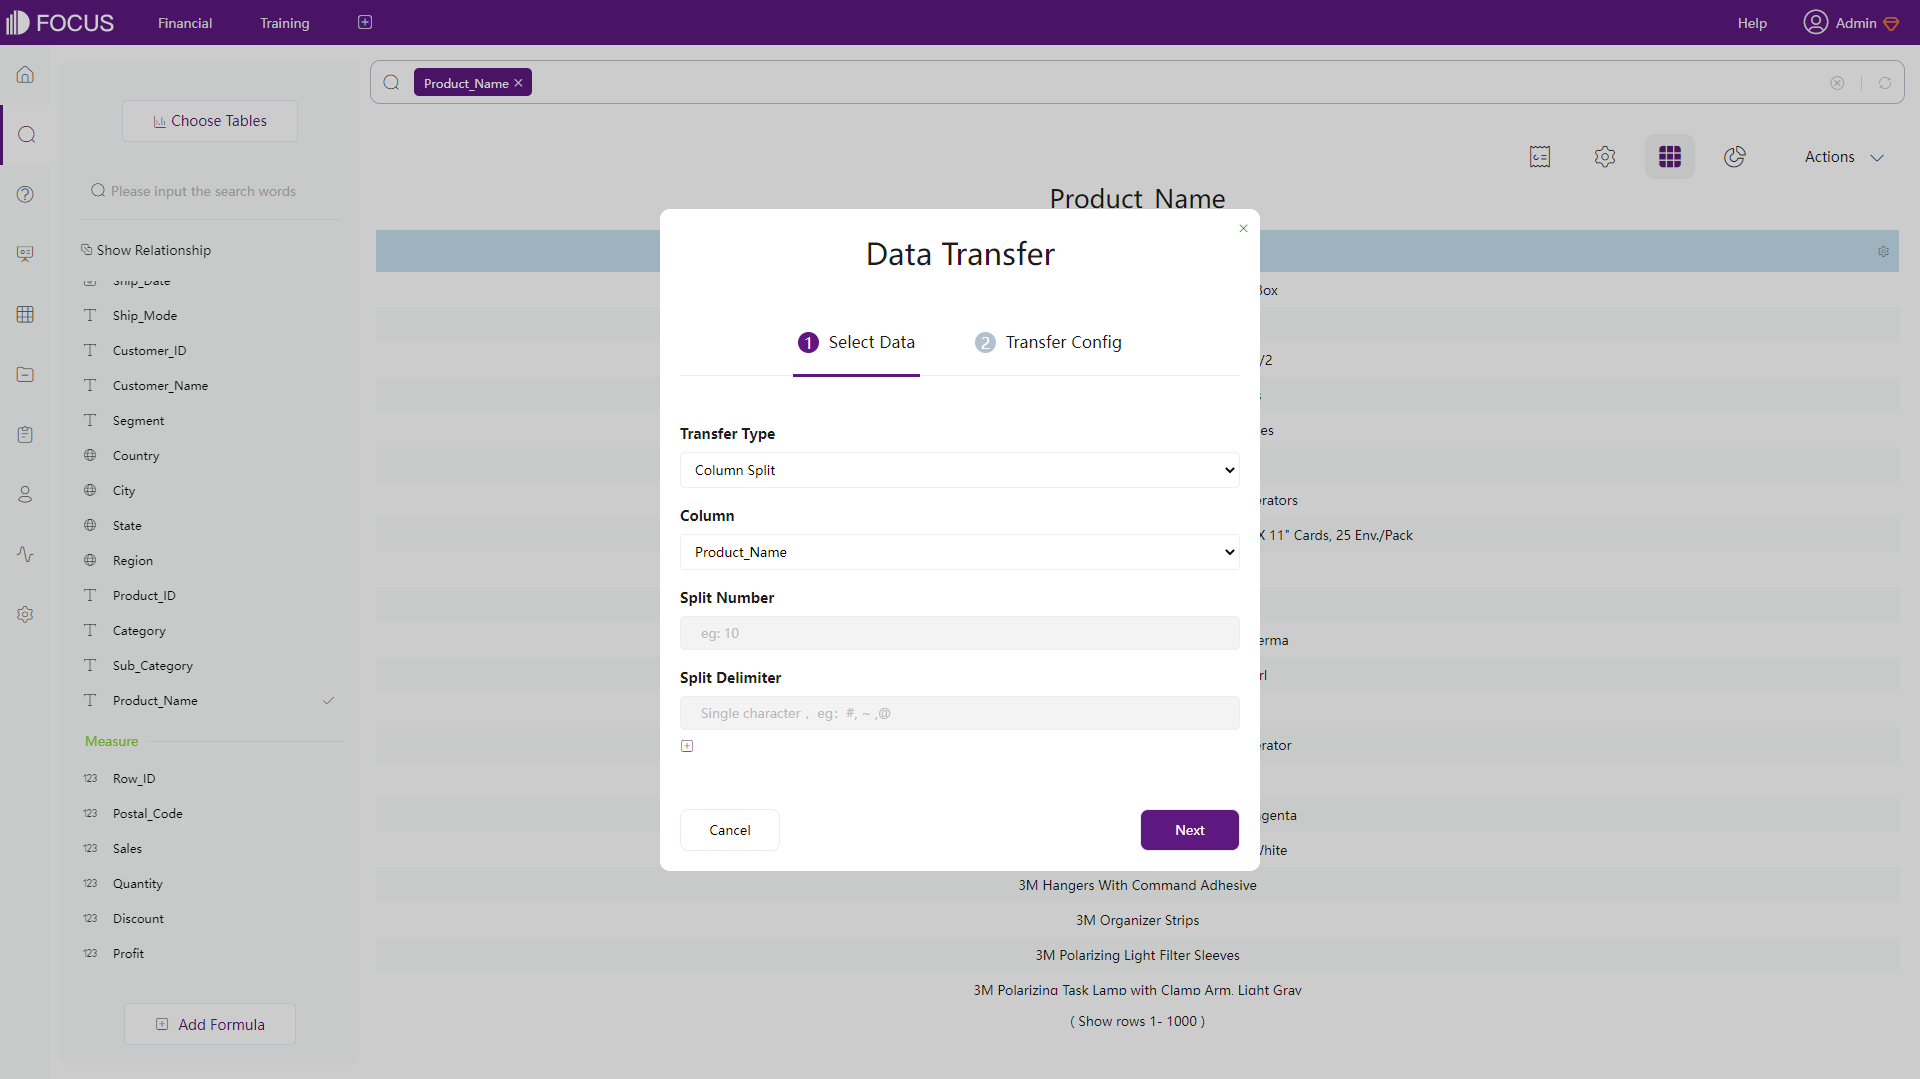
Figure 2-37 Split columns - DFC Other than what mentioned above, DFC also supports intermediate table to help clean data such as transform, merge, filter, etc. Also, the incoming DataSpring would provide much stronger data process abilities.
2.5 Visualization
2.5.1 Table
Both Tibco Cloud Spotfire and DataFocus Cloud has these 2 types of tables: table (called grid table in DFC) and cross table. DFC also provides pivot tables.
-
Table & Grid Table
Tables presents data details in rows and columns. Both two platforms provide changing colors, alignment, and DFC’s grid tables also provides setting header rows, total rows, heatmap mode, etc.
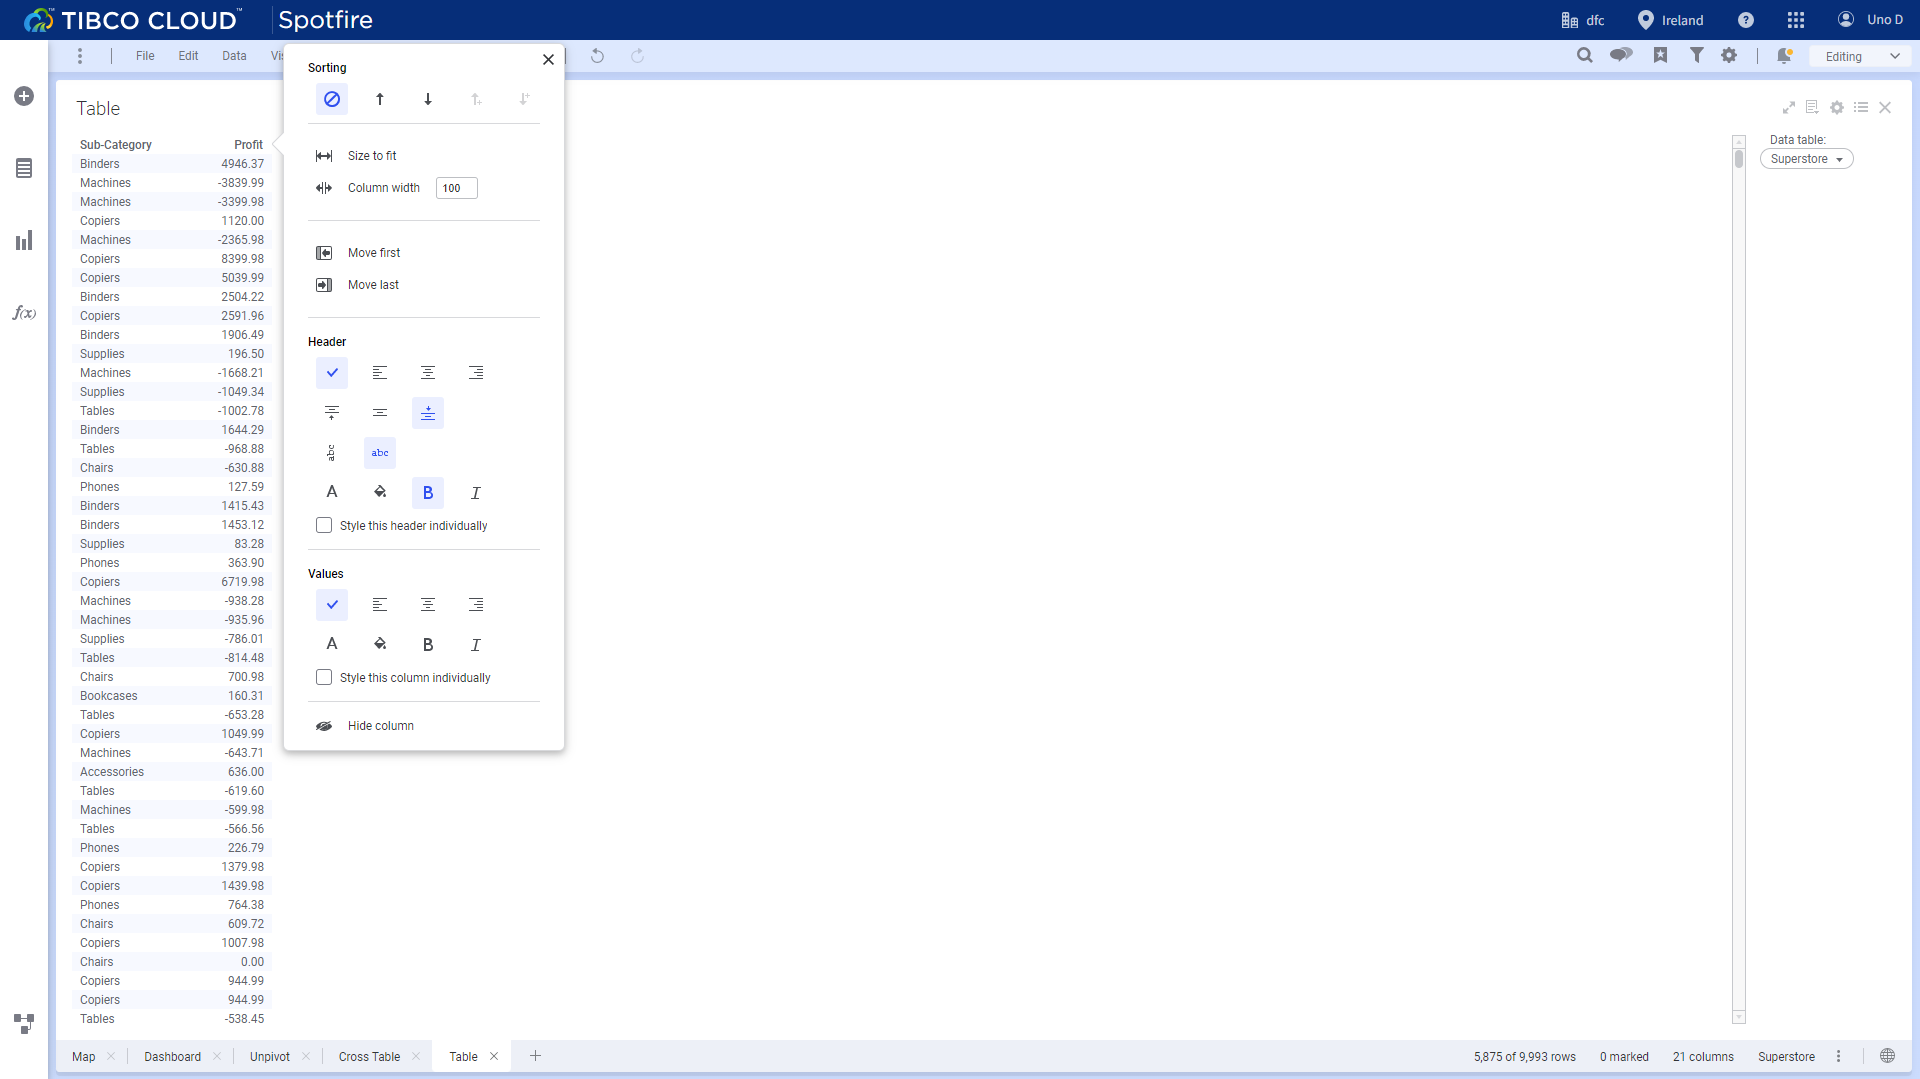
Figure 2-38 Table - Tibco Cloud Spotfire 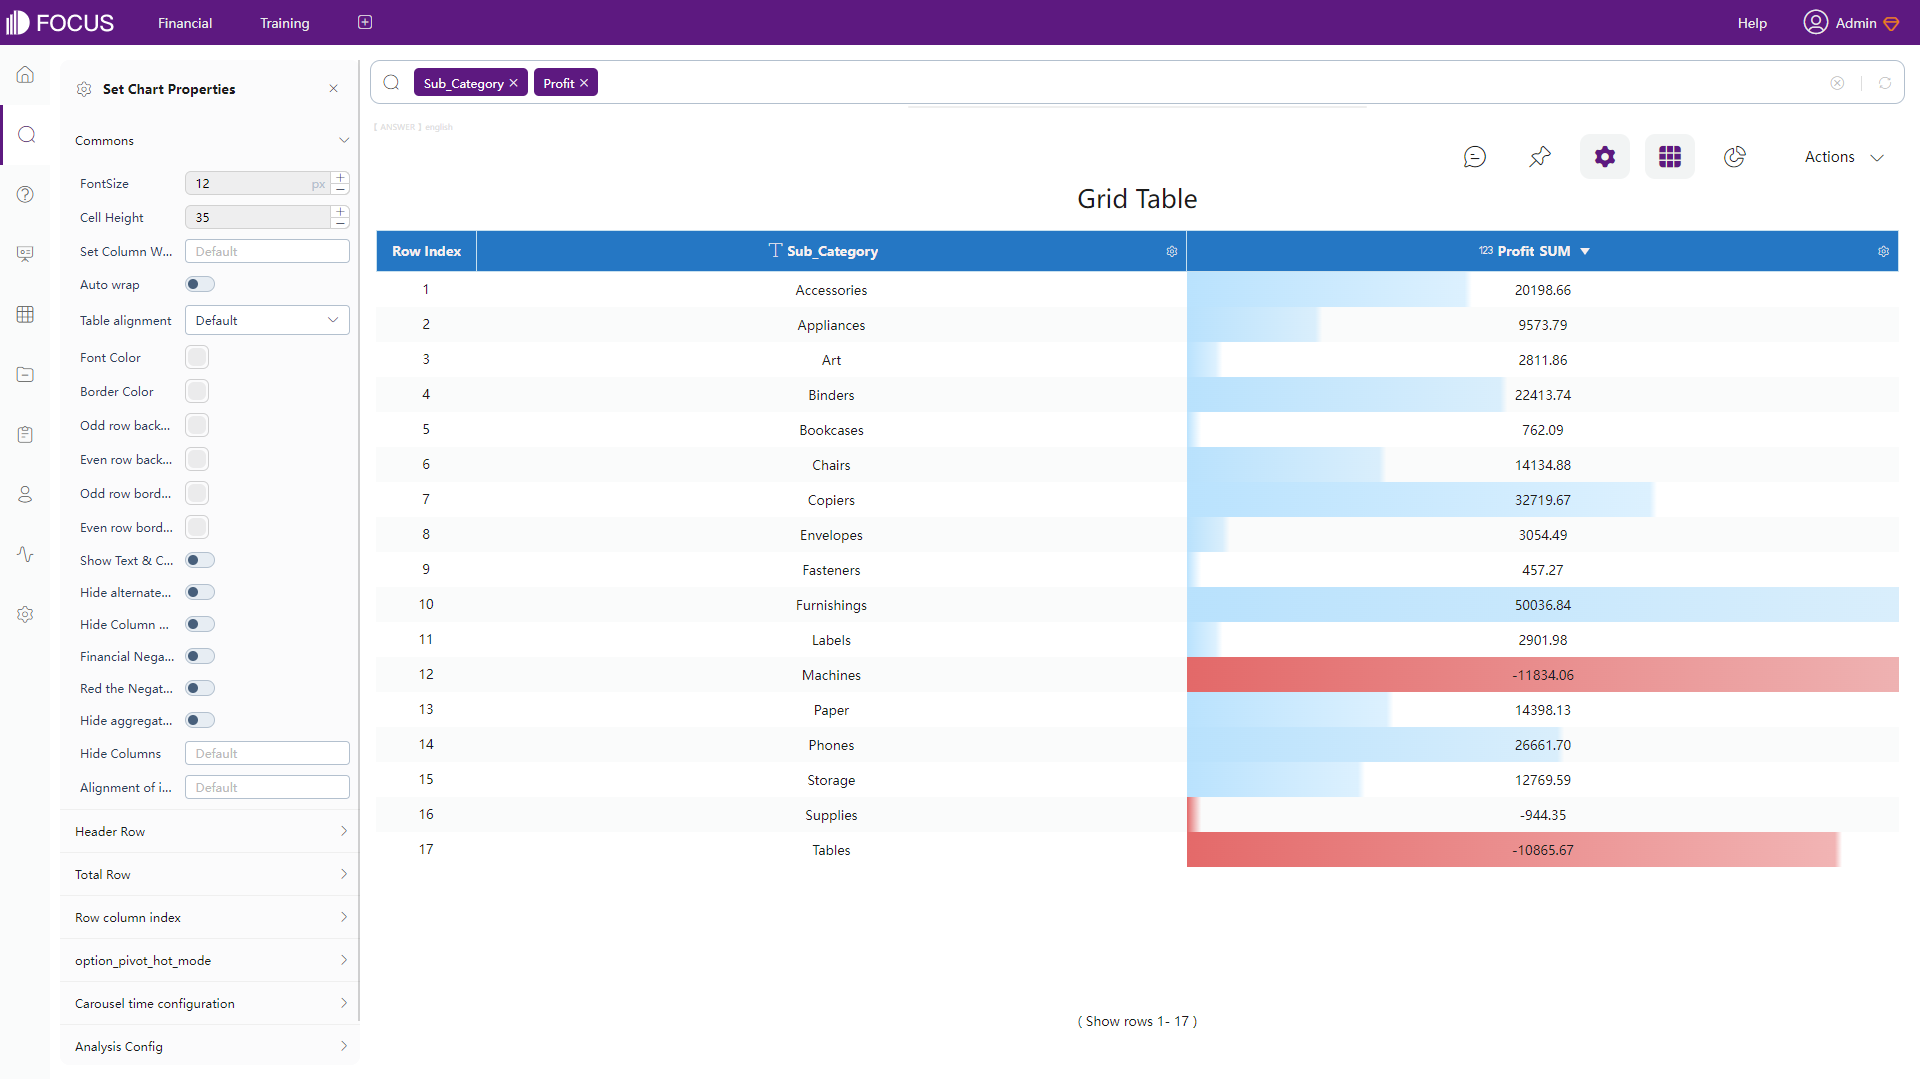
Figure 2-39 Grid table - DFC -
Cross Table
Cross tables exhibits multi-dimensional data and can is suitable for complex business scenarios. Users can add grand totals and subtotals. Furthermore, DFC’s cross tables provide pinning headers so that certain columns or rows stay still when moving the table.
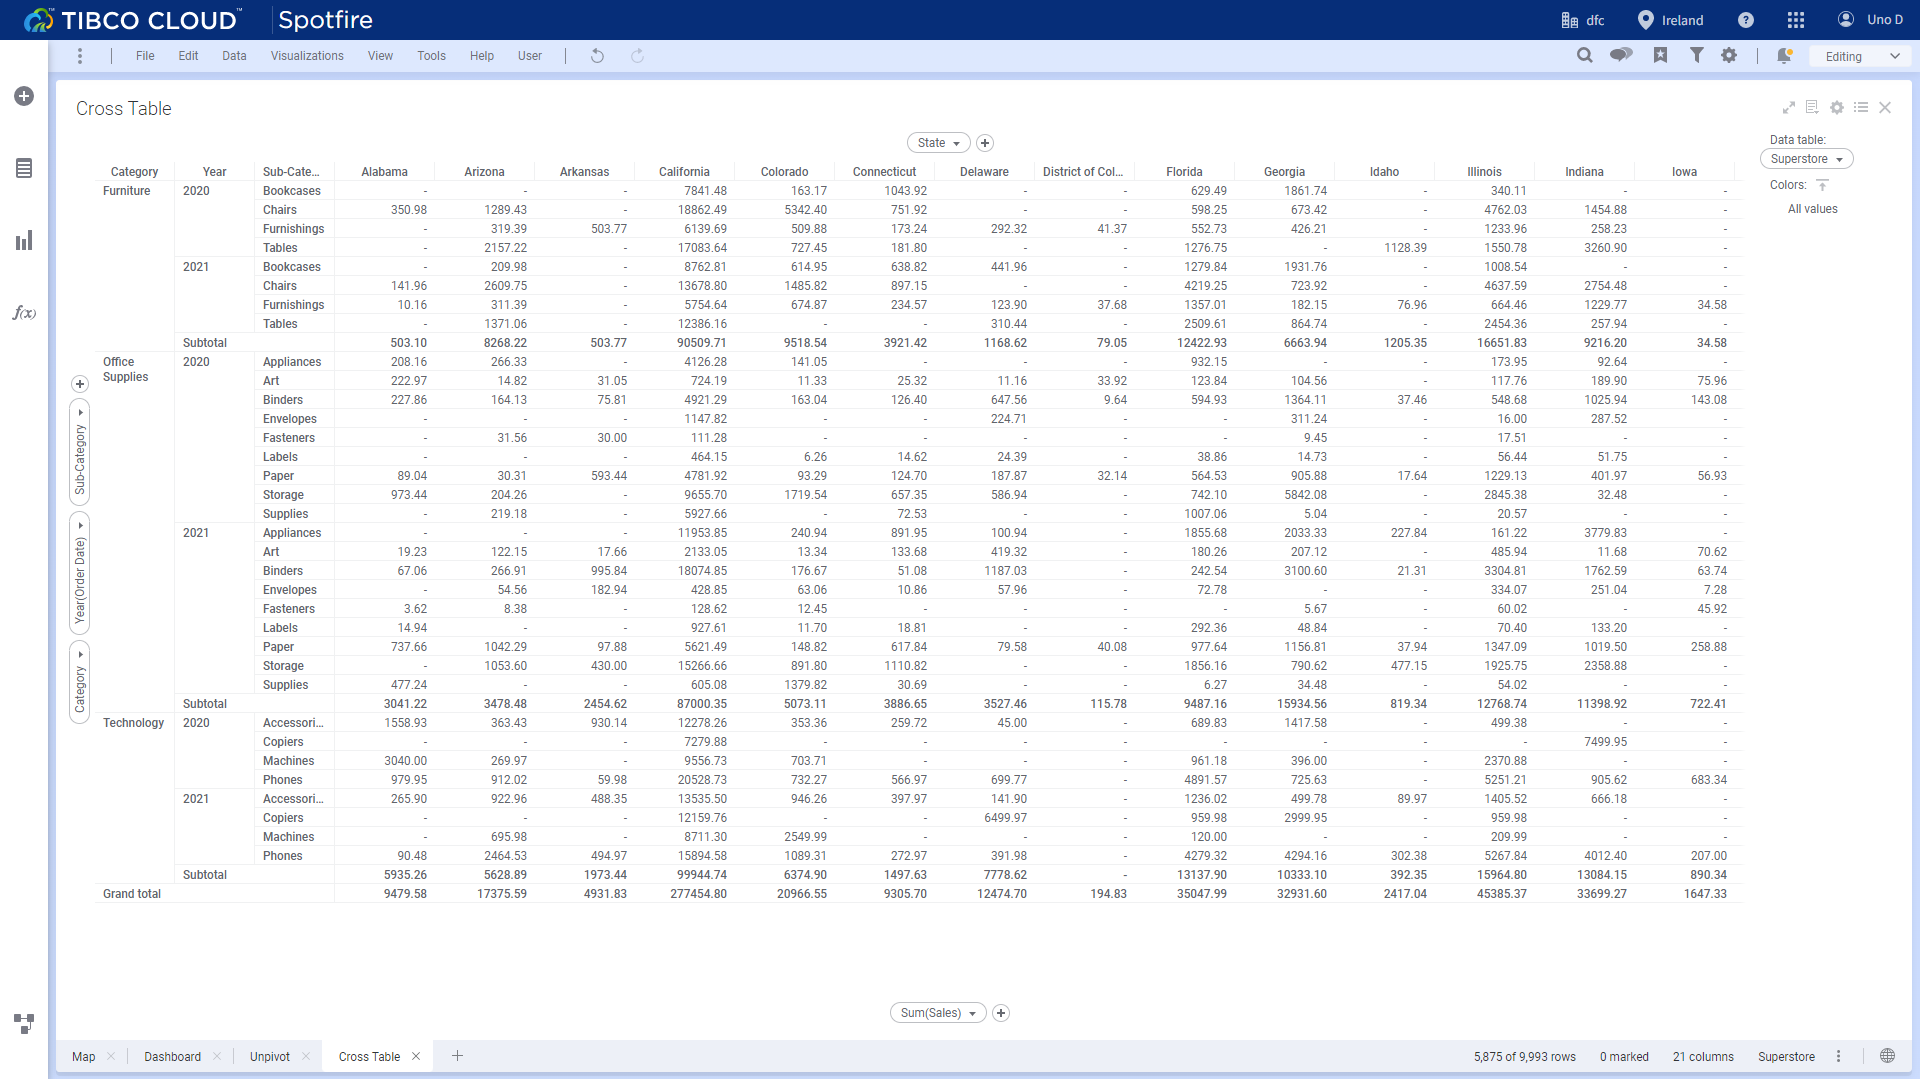
Figure 2-40 Cross table - Tibco Cloud Spotfire 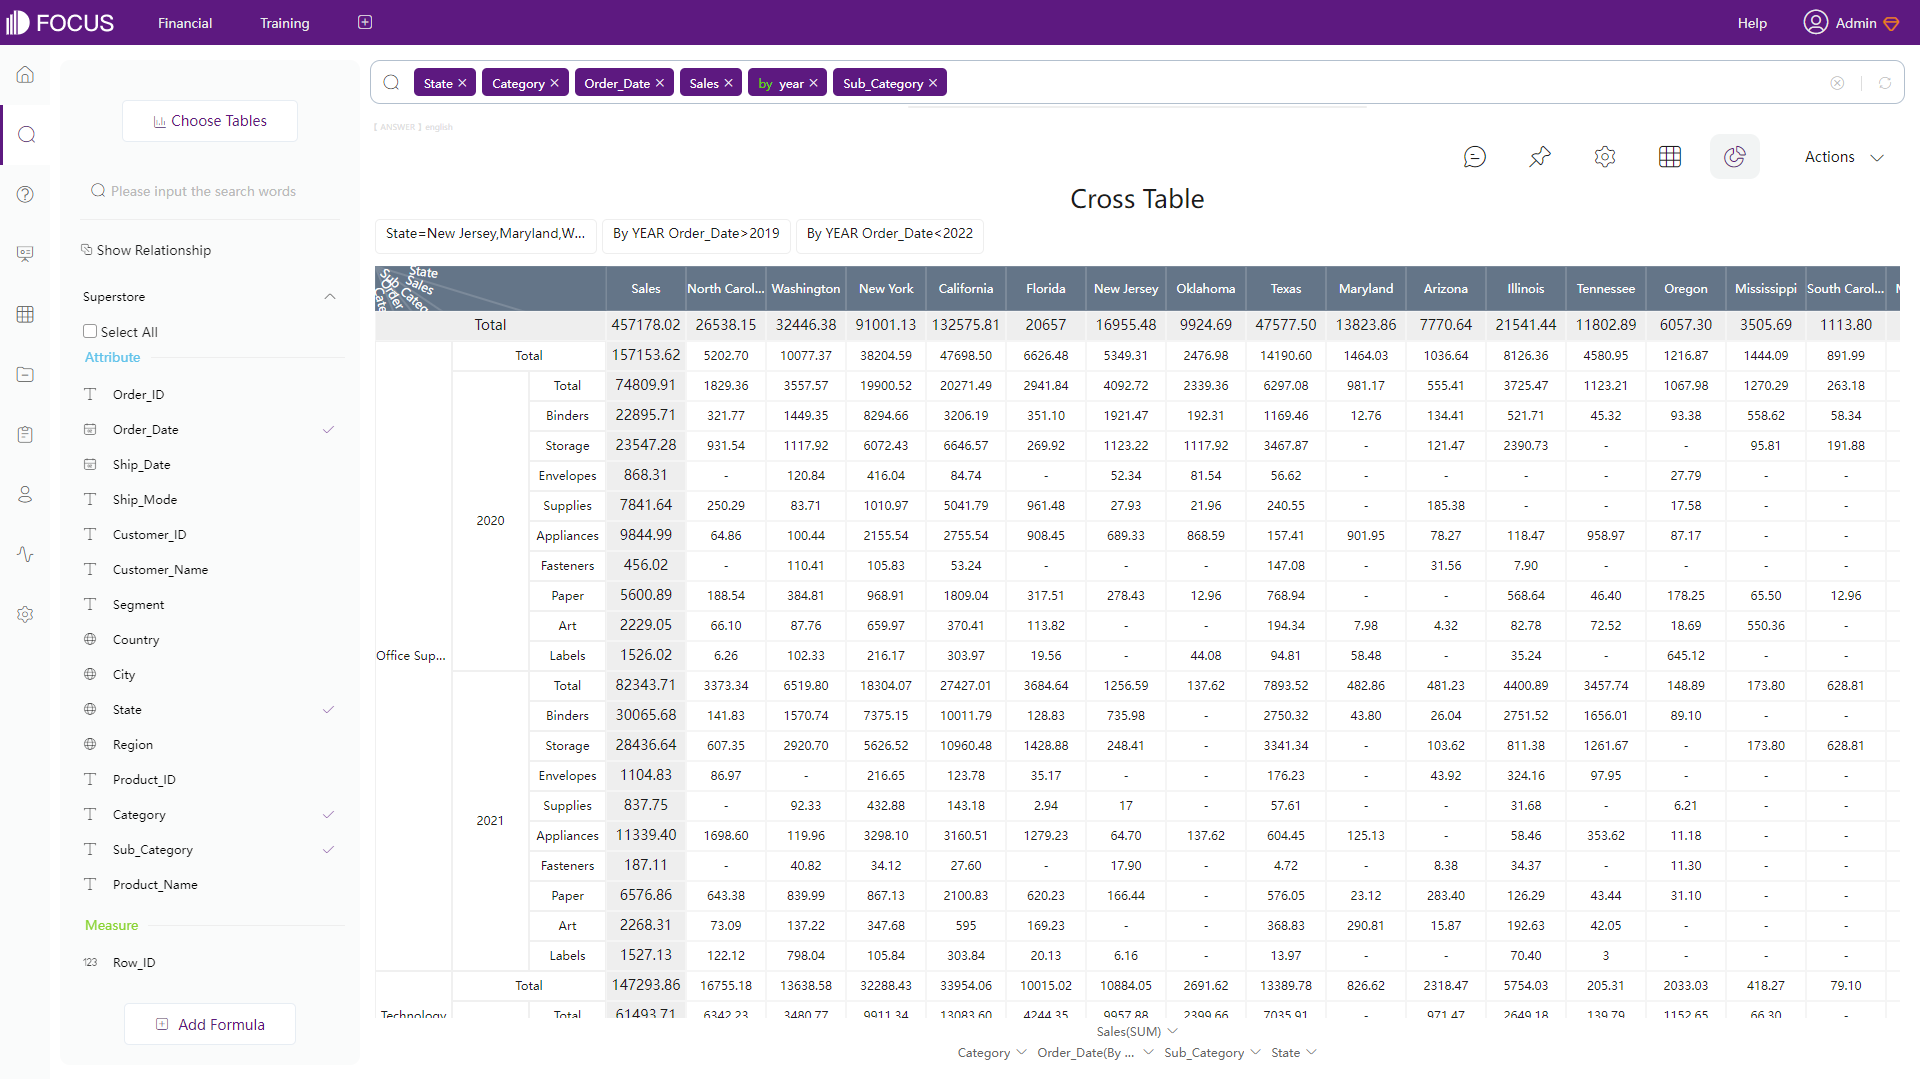
Figure 2-41 Cross table - DFC -
Pivot Table
Pivot tables can summarize large numbers of data. Possible configurations are similar to grid table.
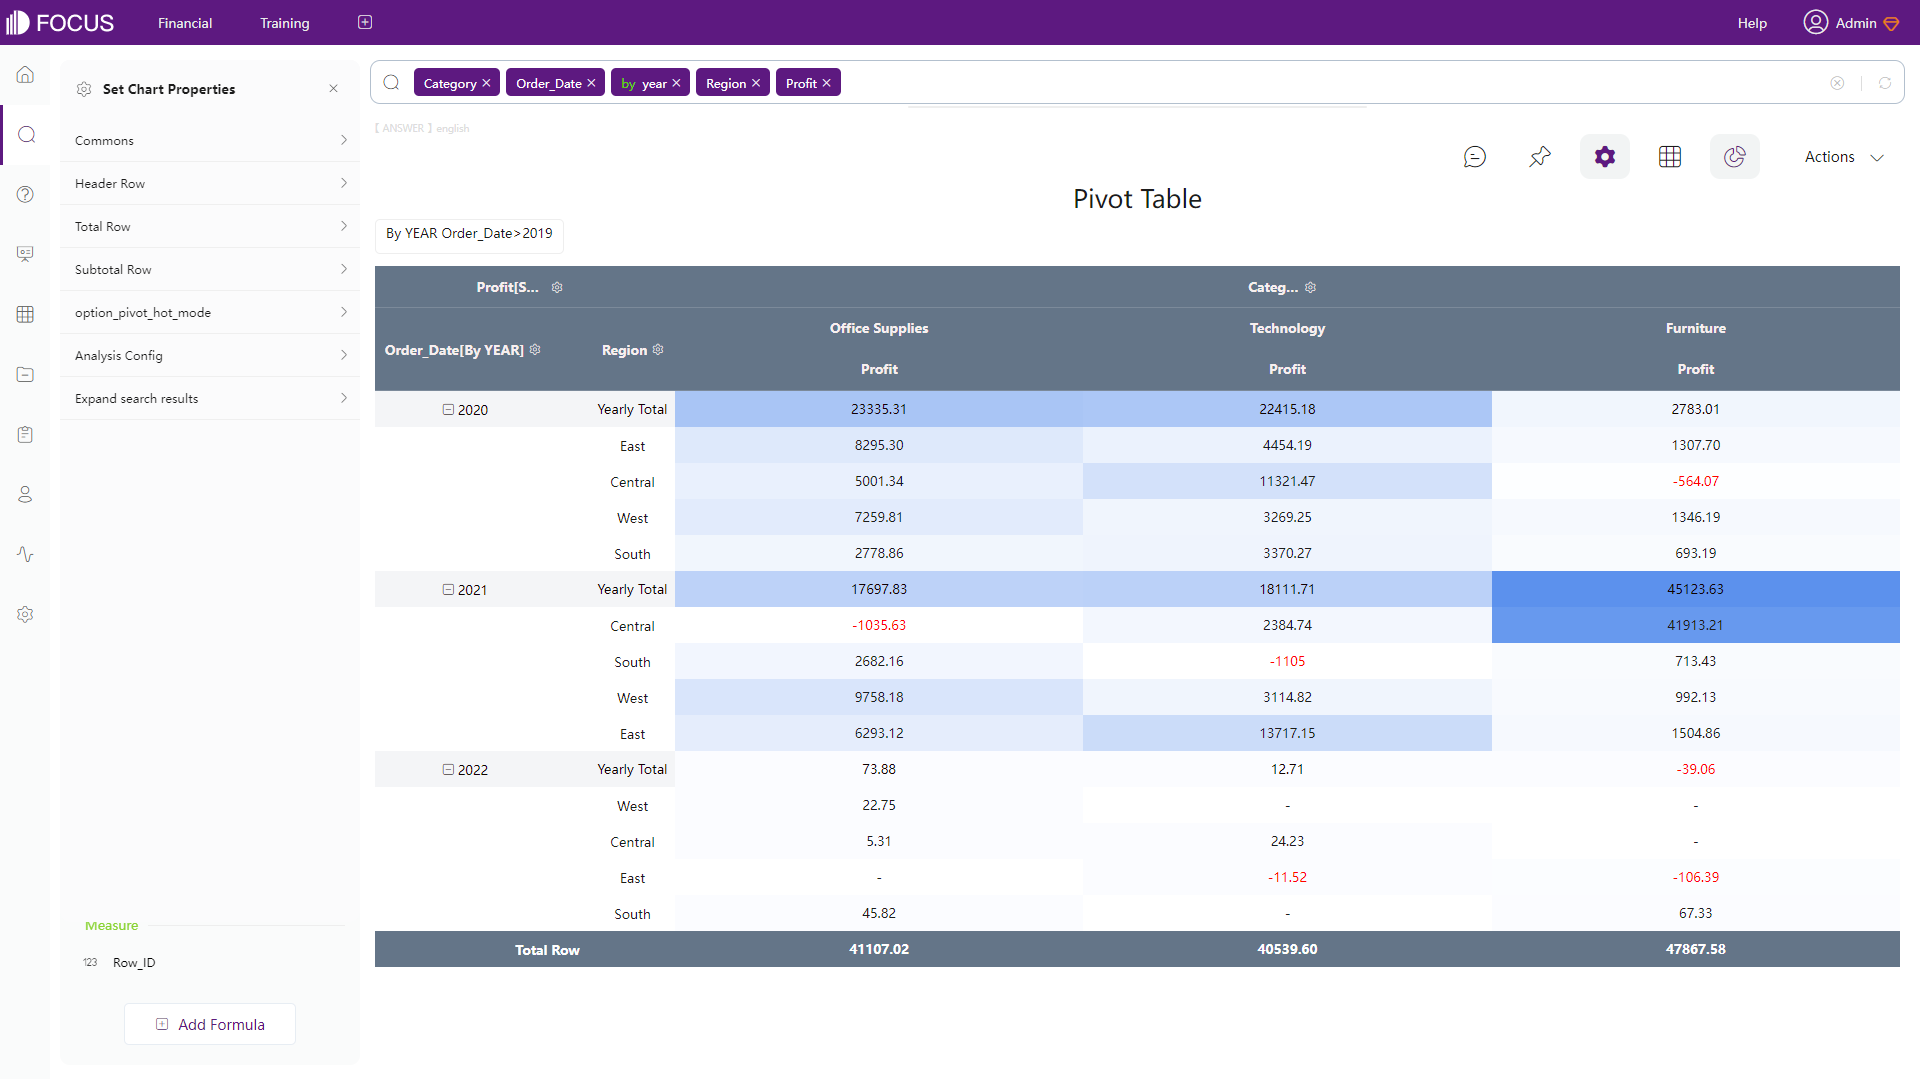
Figure 2-42 Pivot table - DFC
2.5.2 Chart
Tibco Cloud Spotfire supports 12 kinds of charts (including tables) and DataFocus Cloud supports over 50 types of charts. Like what has been mentioned above, both tools provide different configurations for chart. DFC has a high level of customization for configurations where users can freely create their own charts like add suspend texts, labels, etc. Four kinds of charts are compared below.
-
Common Charts
The two platforms provide bar charts, line charts, combination charts, pie charts, etc.
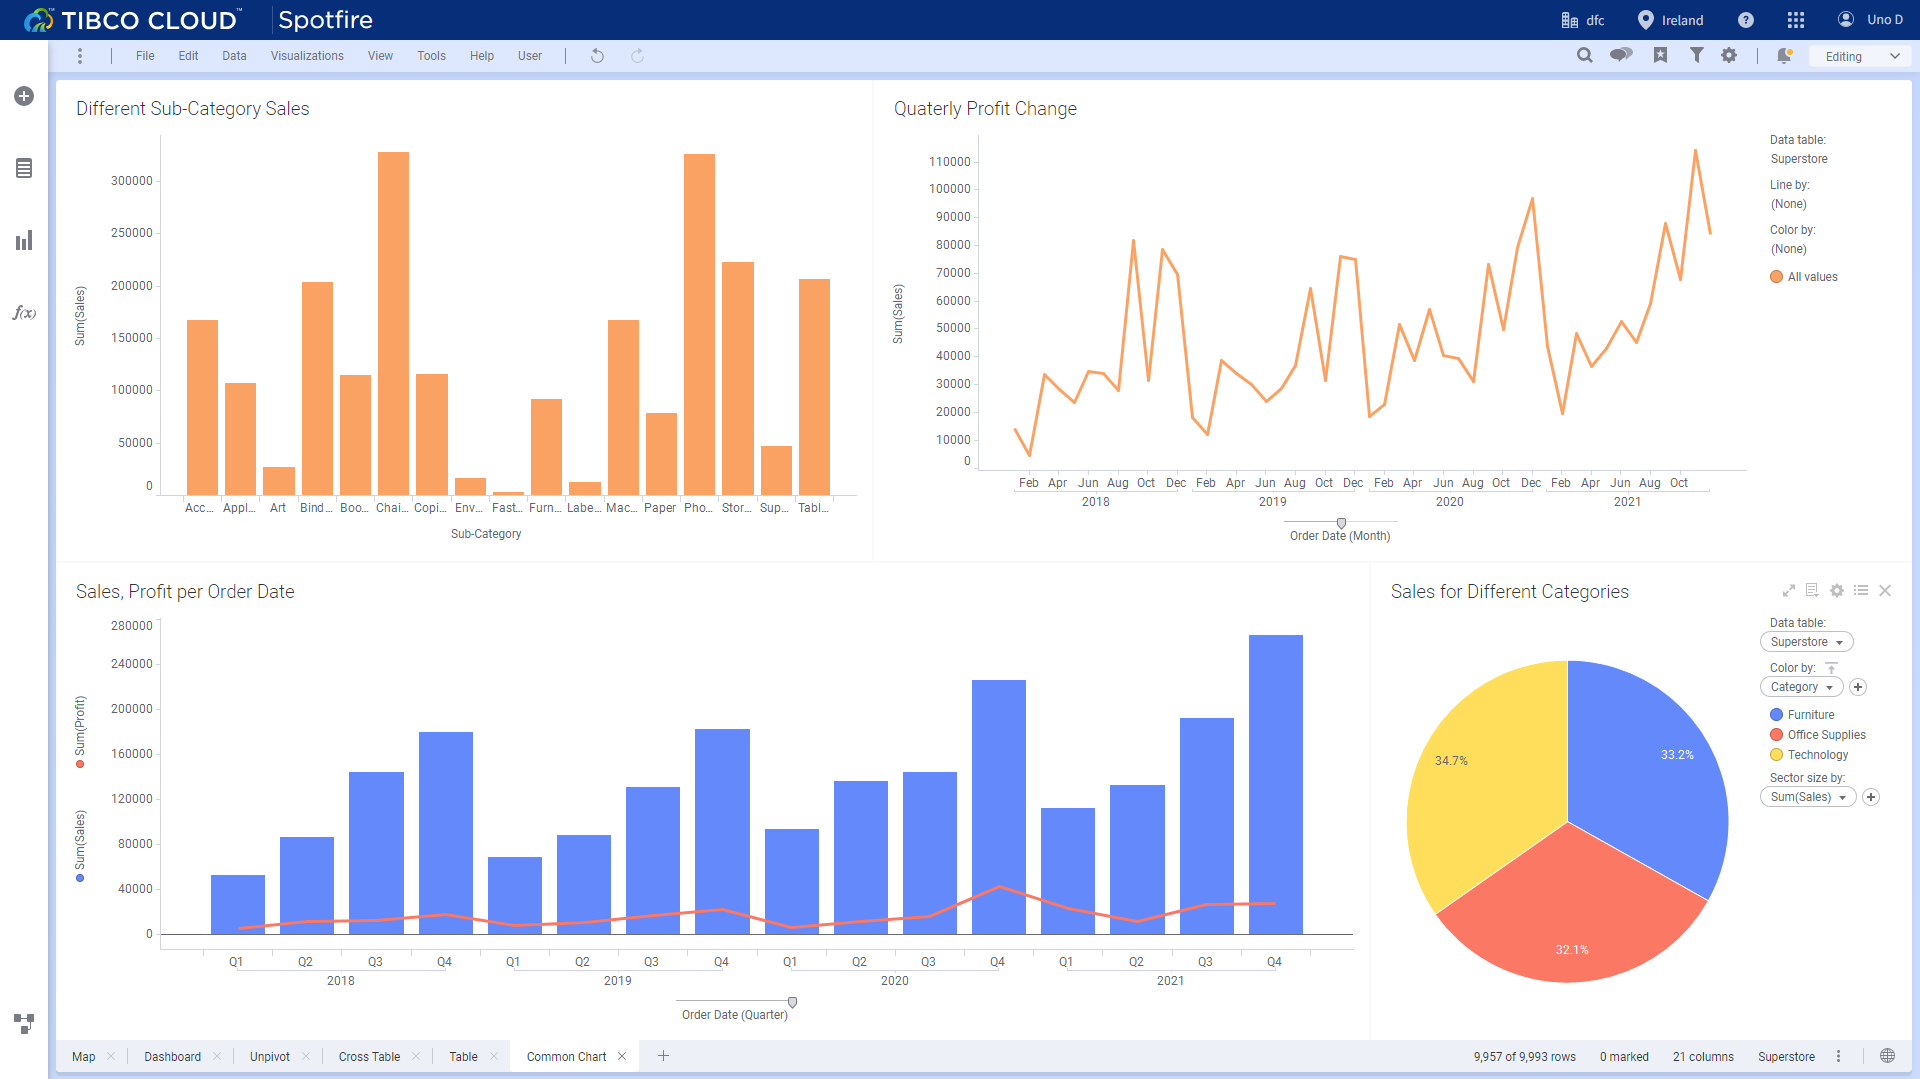
Figure 2-43 Common charts - Tibco Cloud Spotfire 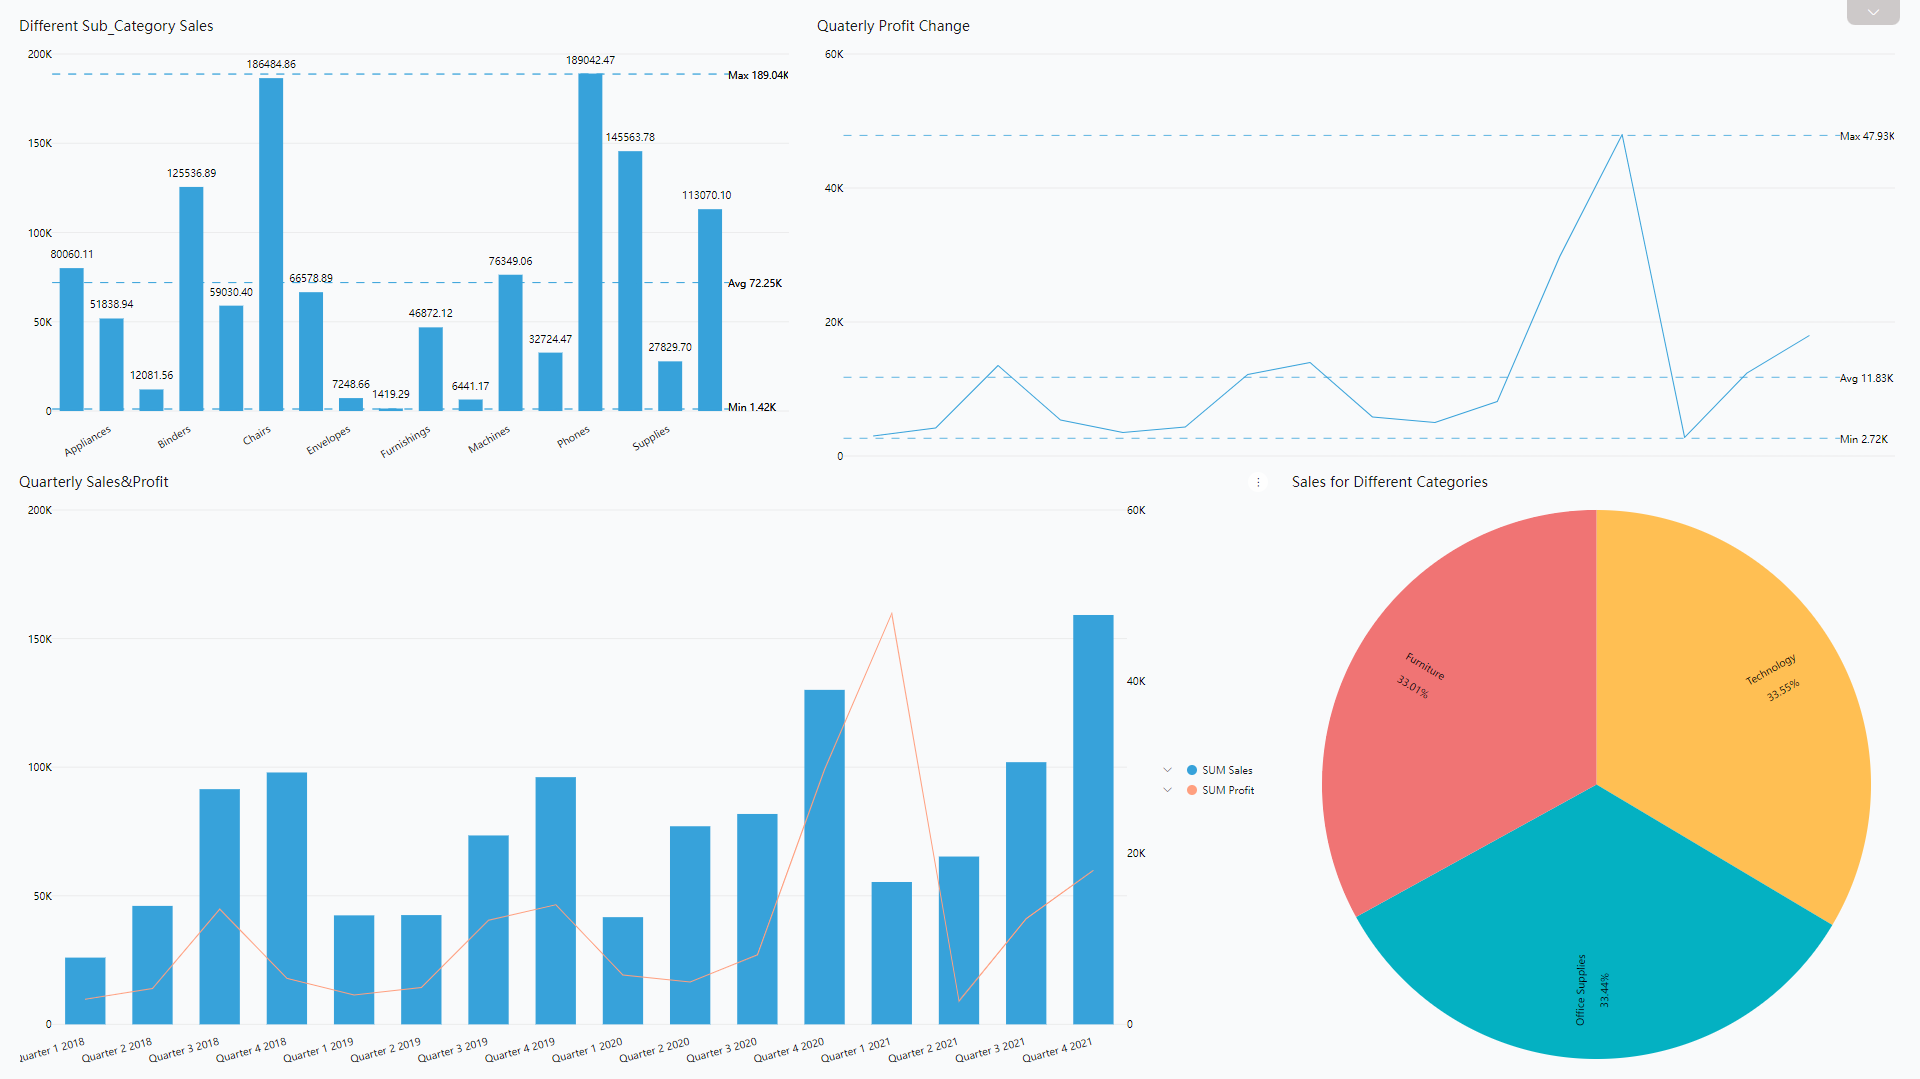
Figure 2-44 Common charts - DFC -
Maps
Tibco Cloud Spotfire has 1 kind of map chart. Users can use color, shape, and size to add more details.
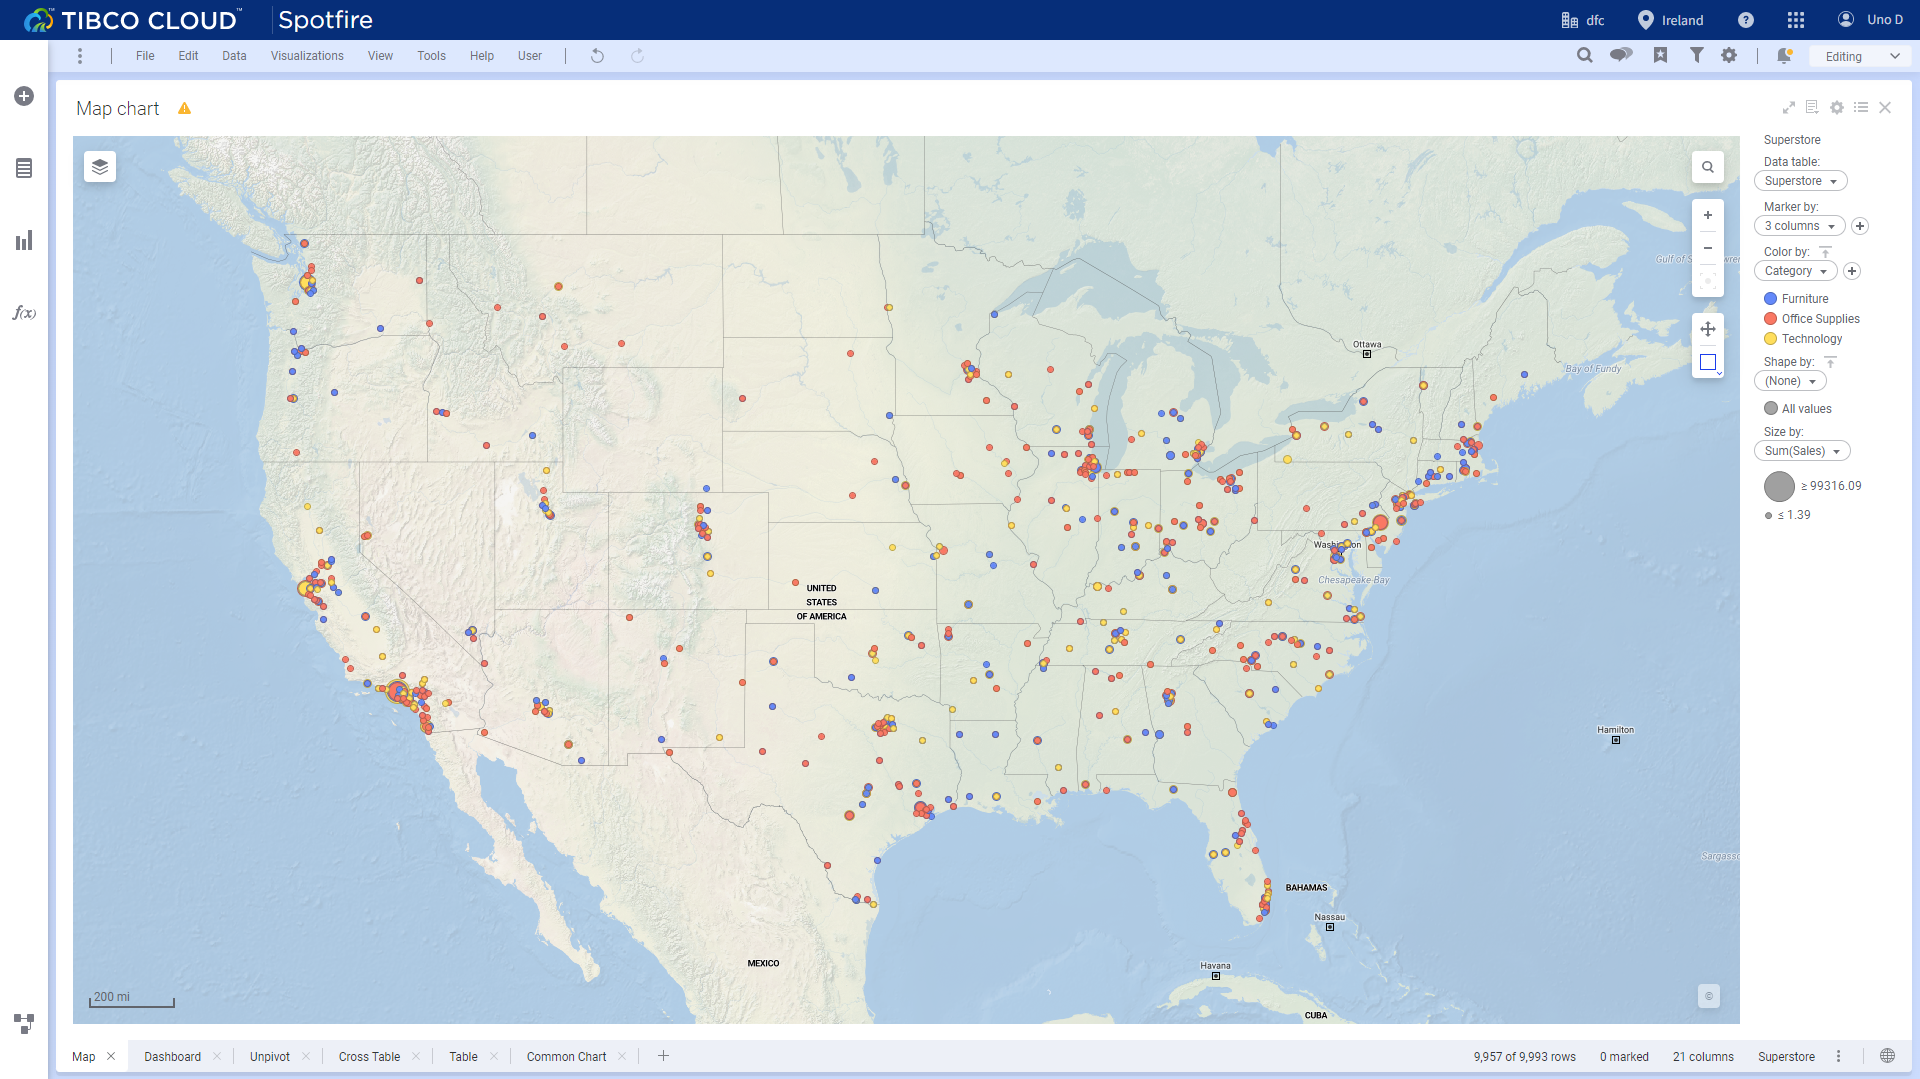
Figure 2-45 Map - Tibco Cloud Spotfire DFC provides GIS location map, ll (longitude&latitude) location map, trajectory map, 3D scatter plot, etc., and custom geographical data can be imported.
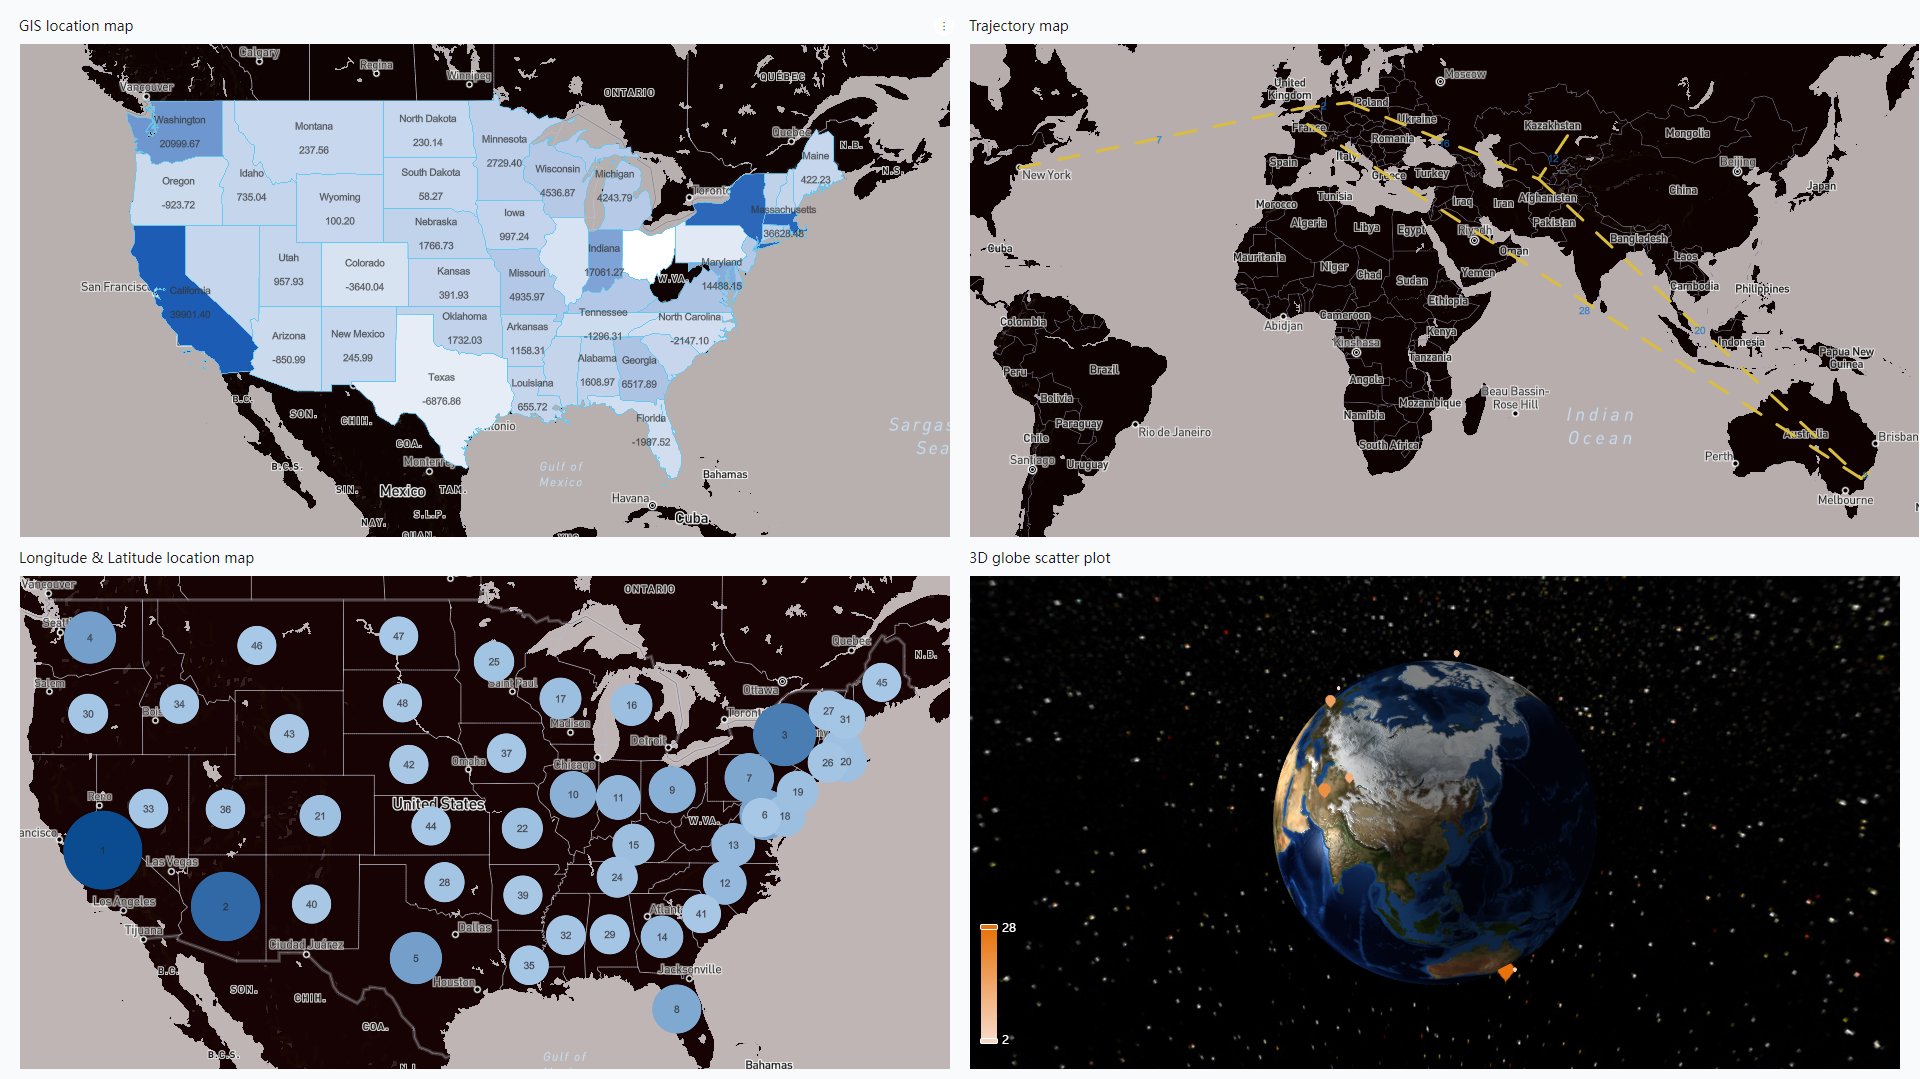
Figure 2-46 Maps - DFC -
Advanced Graphics
Examples from both tools: waterfall chart, treemap, scatter plot, parallel coordinate diagram.
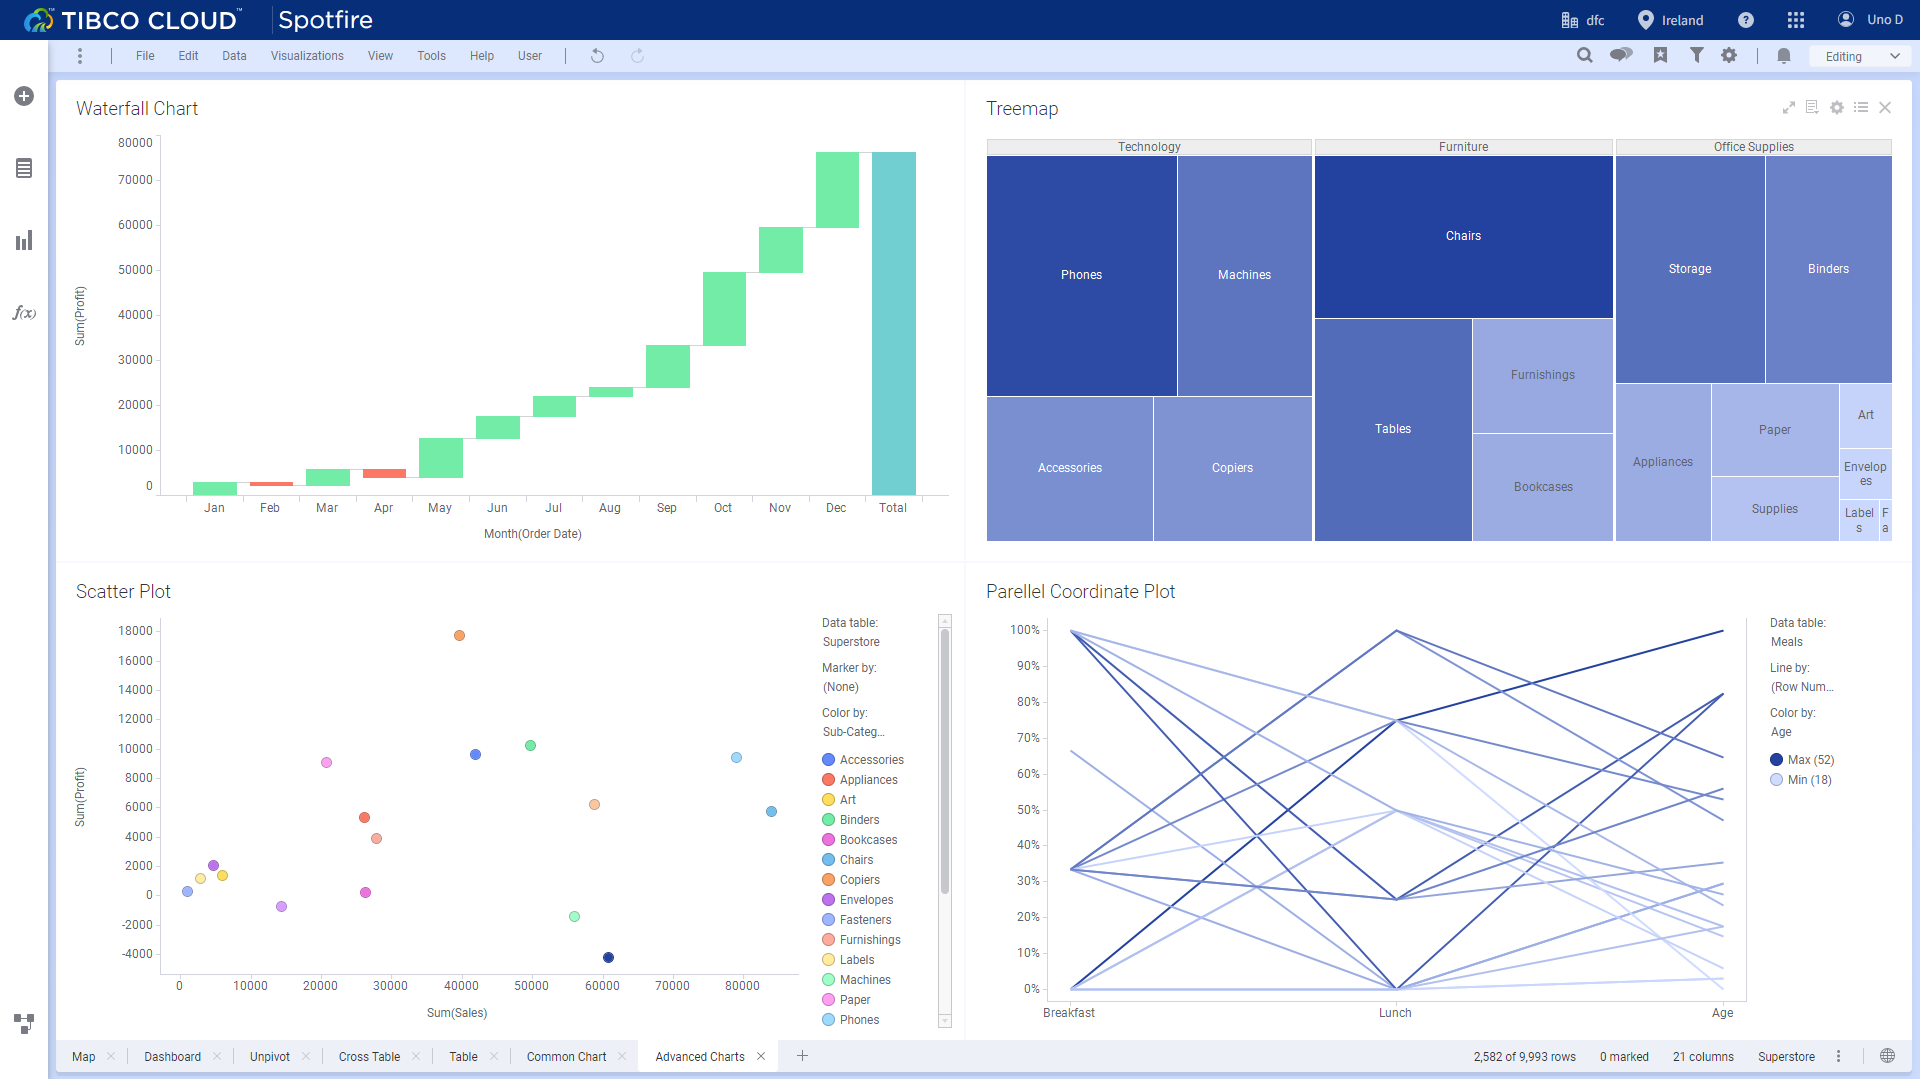
Figure 2-47 Advanced charts - Tibco Cloud Spotfire 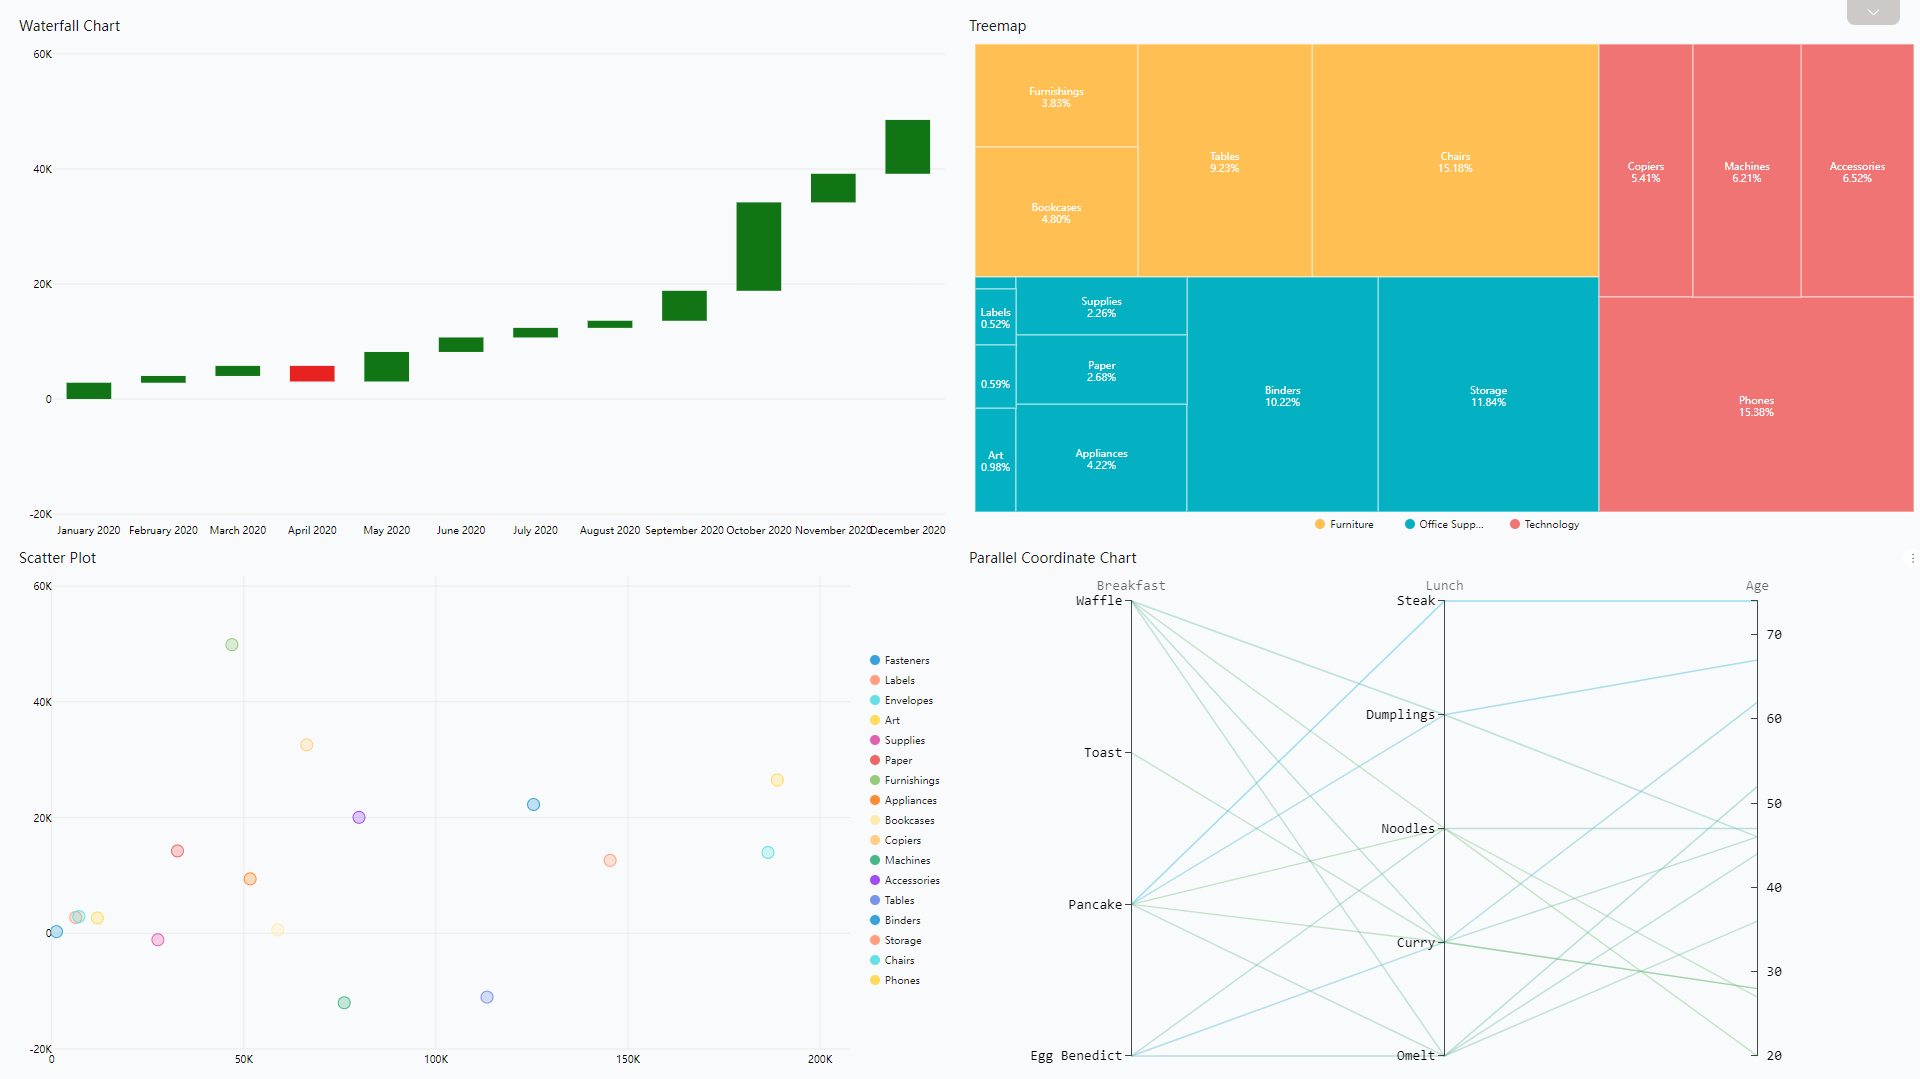
Figure 2-48 Advanced charts 1 - DFC Other examples from DFC: radar map, sunburst diagram, correlation heatmap, Sankey diagram, etc.
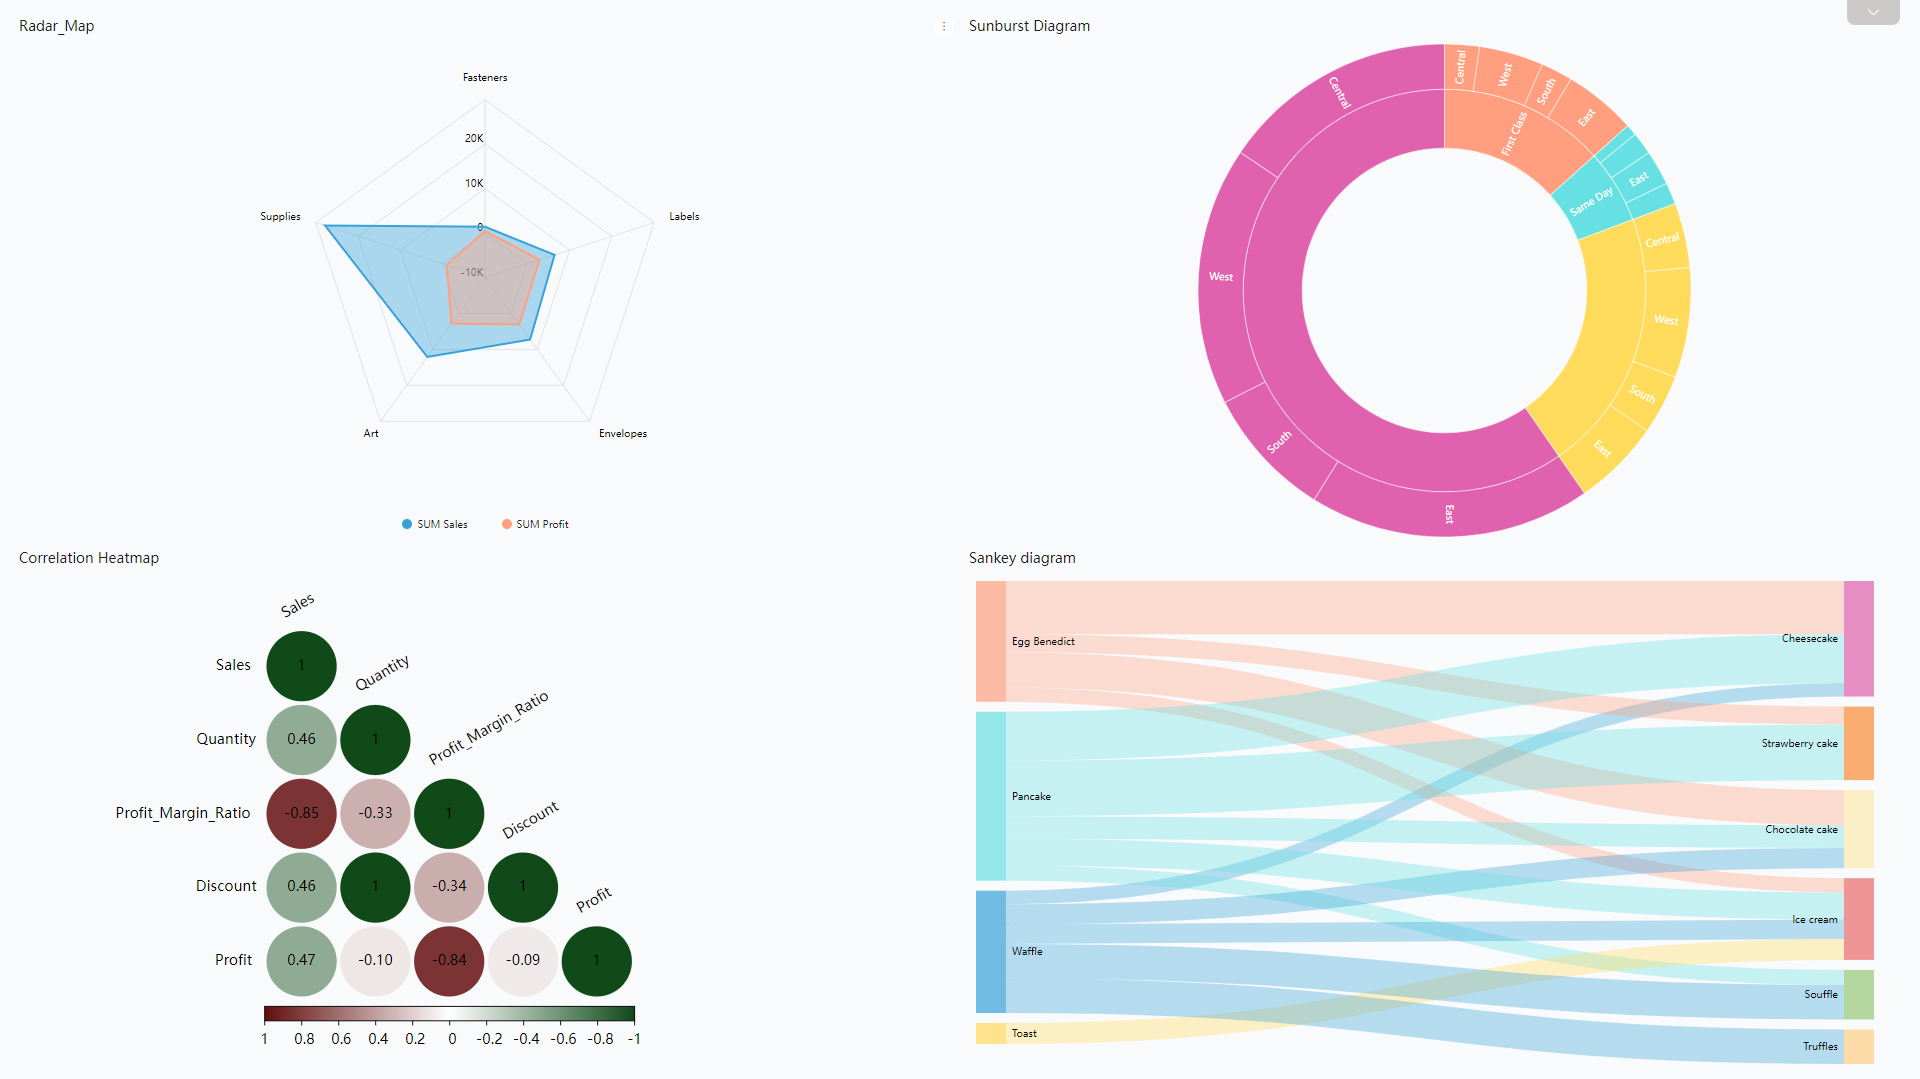
Figure 2-49 Advanced charts 2 - DFC -
Dynamic Graphics
DFC also supports dynamic charts, like time series bubble chart, 3D globe fly line, etc.
GIF Figure 2-50 Time series bubble chart 
GIF Figure 2-51 3D globe fly line
2.5.3 Dashboard
| Aspect | Tibco Cloud Spotfire | DataFocus Cloud |
|---|---|---|
| Dashboard Size | Constant | Customized |
| Layout | Drag | Free & Grid |
| Background | Custom | Custom |
| Multiple Dashboards | Page | Carousel |
| More | / | Interaction objects, dashboard templates… |
-
Dashboard Size
Dashboards of Tibco Cloud Spotfire have a constant size, as shown previously on the chart part.
Dashboards in DFC have multiple options of sizes, users can choose between preset and custom sizes.
GIF Figure 2-52 Dashboard size - DFC -
Layout
Dragging charts to different positions to change layouts in Tibco Cloud Spotfire, and other charts would adjust accordingly, as shown below.
GIF Figure 2-53 Layout - Tibco Cloud Spotfire Two kinds of layout modes are available in DFC, where users can either get help from grids or place components freely.
GIF Figure 2-54 Layouts - DFC -
Background
As shown below, in Tibco Cloud Spotfire, users can choose from different canvas styles, and can edit custom themes.
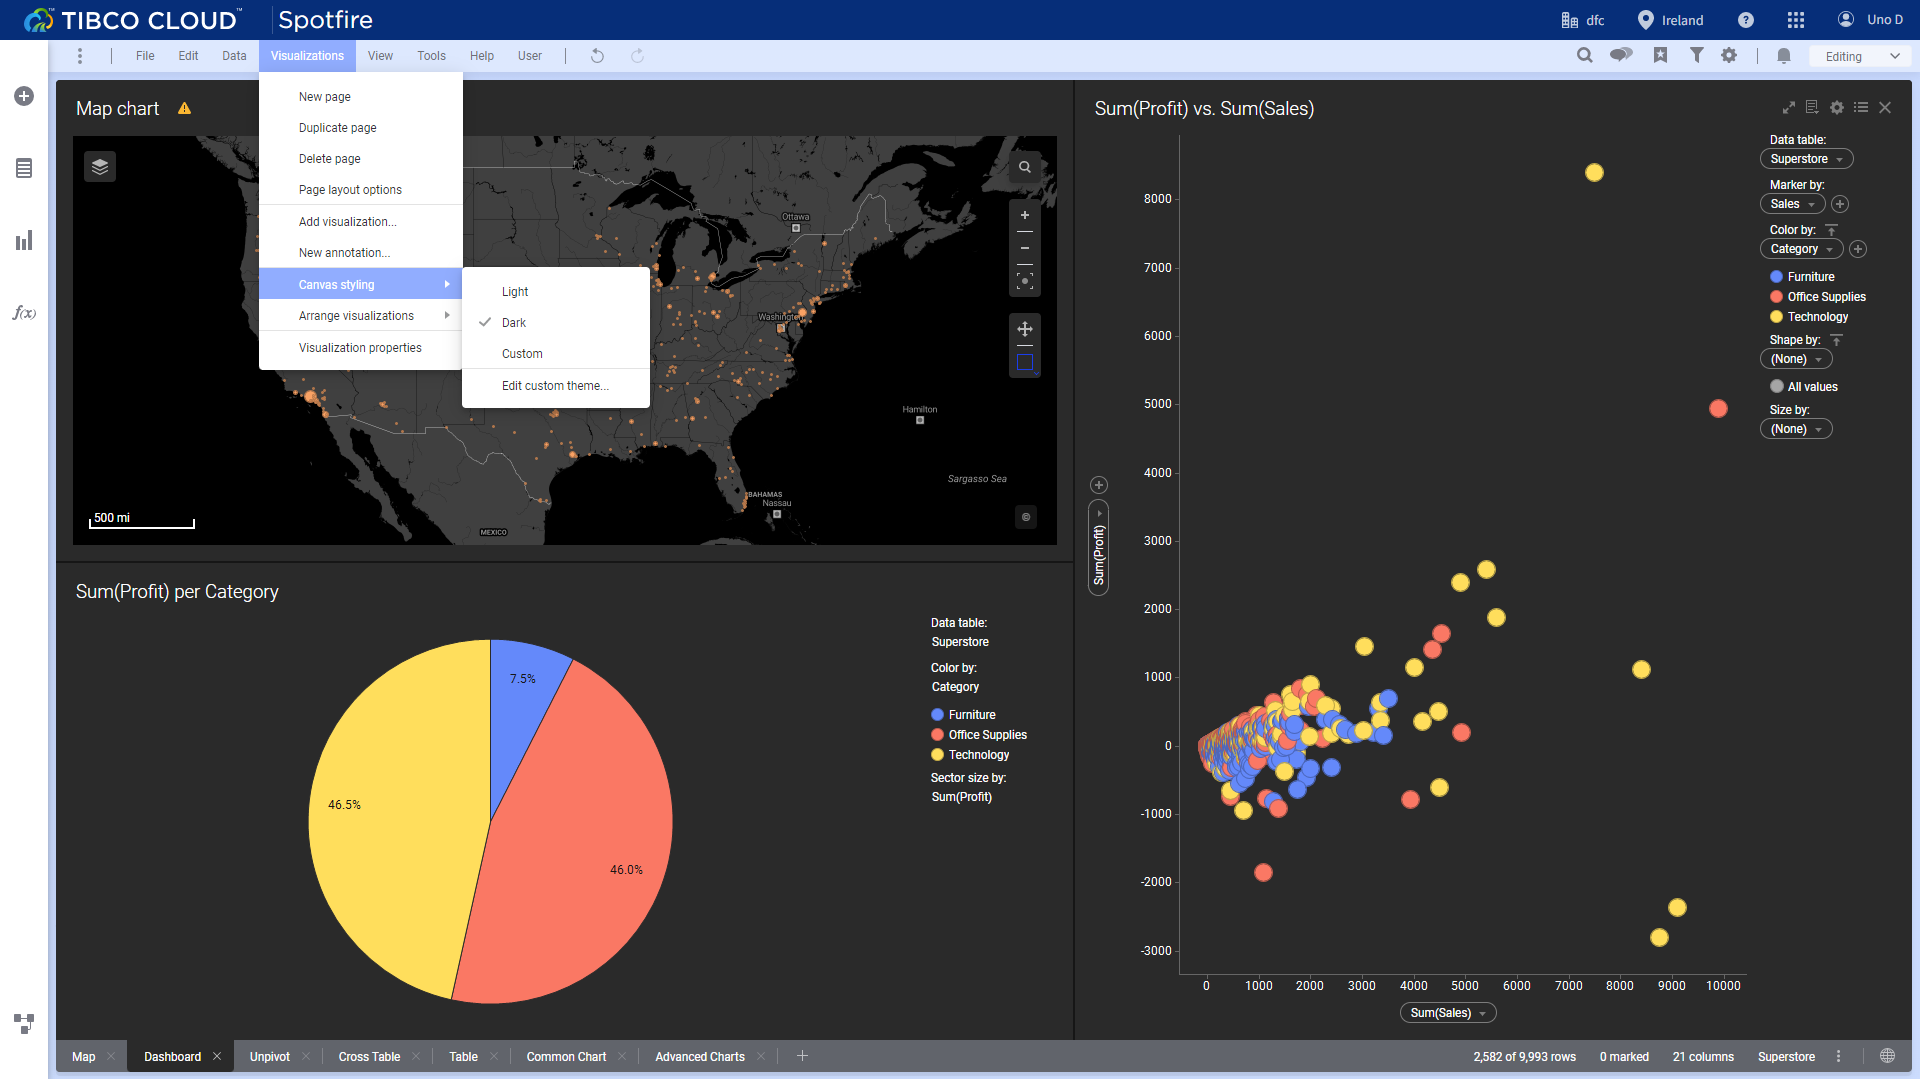
Figure 2-55 Background - Tibco Cloud Spotfire In DFC, users can select different color backgrounds or can upload images as the background.
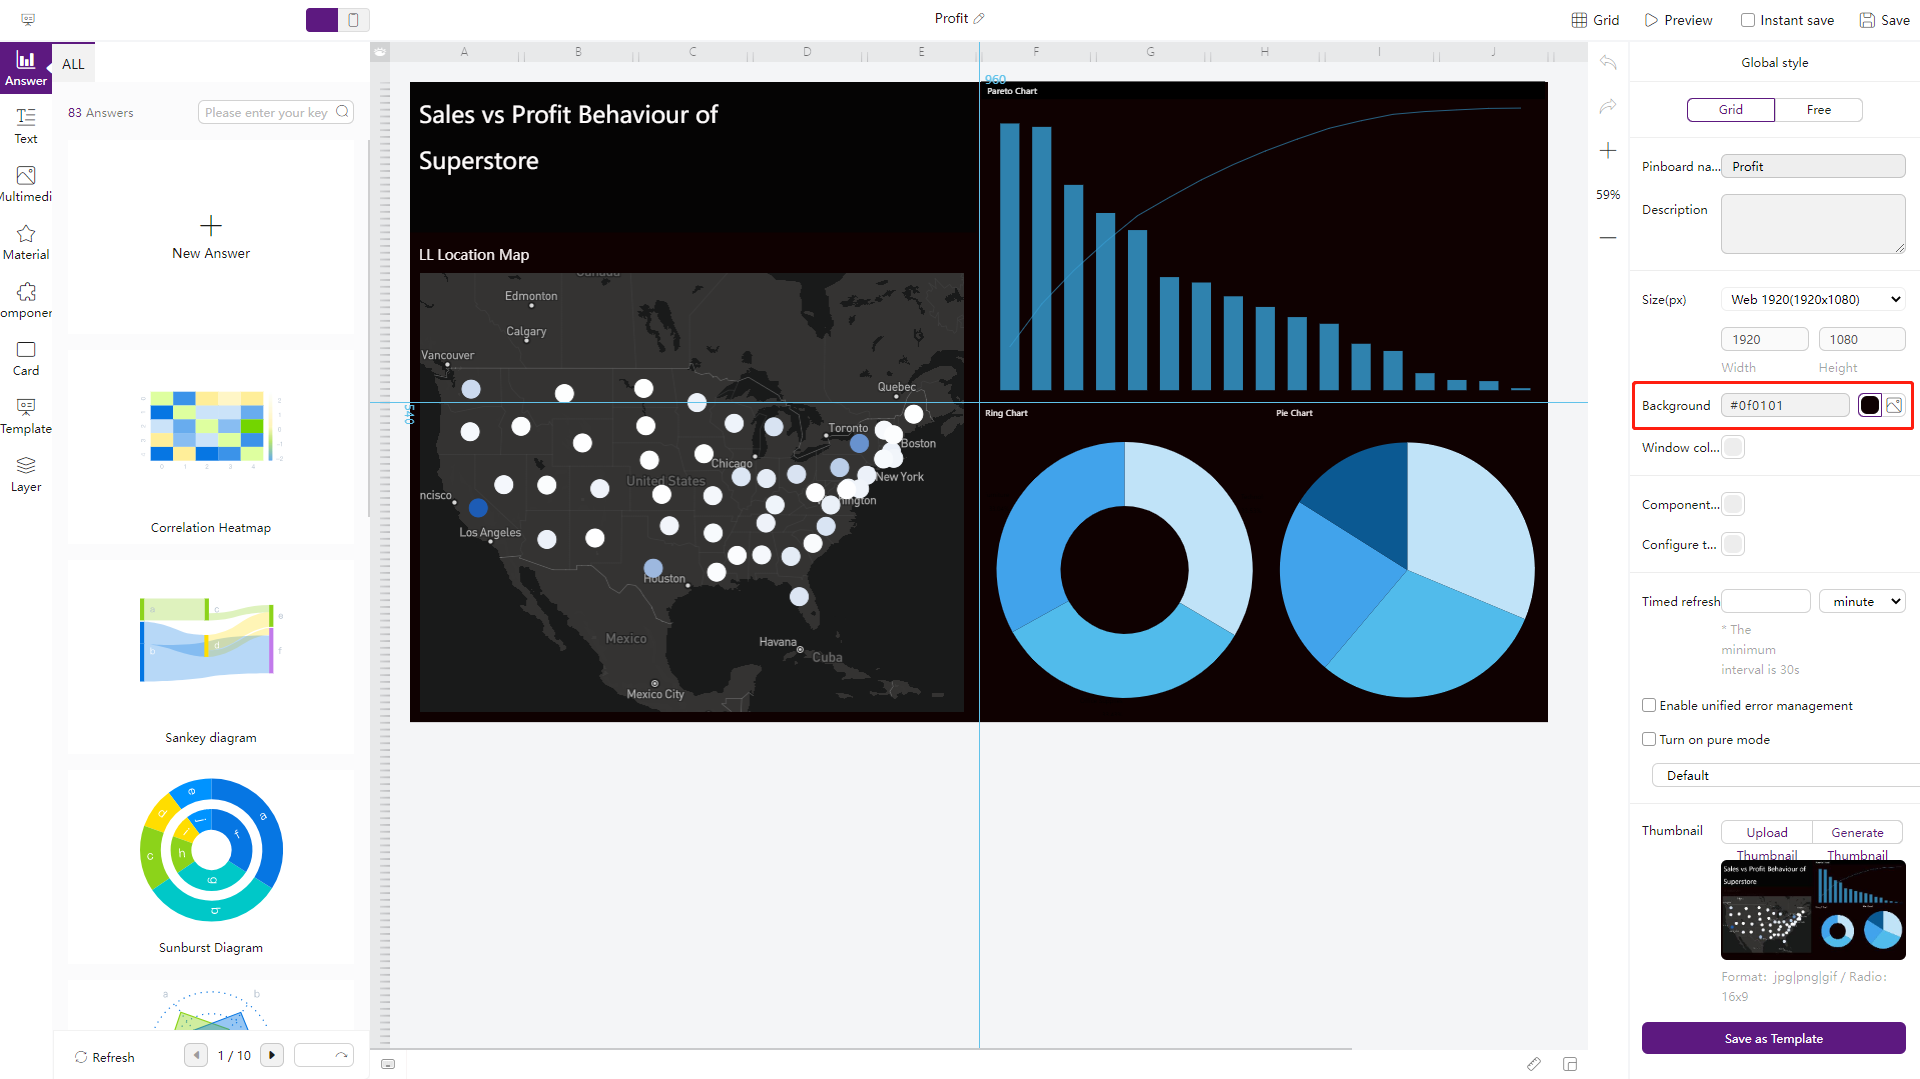
Figure 2-56 Background - DFC -
Multiple Dashboards
Tibco Cloud Spotfire utilizes “pages” to switch and display different dashboards, while DFC utilizes dashboard carousel to do so.
GIF Figure 2-57 Multiple dashboards - Tibco Cloud Spotfire 
GIF Figure 2-58 Multiple dashboards - DFC -
More
DataFocus Cloud provides many different customization options. Users can not only add various interaction objects and custom components, but also can directly use dashboard templates to make visualizations.
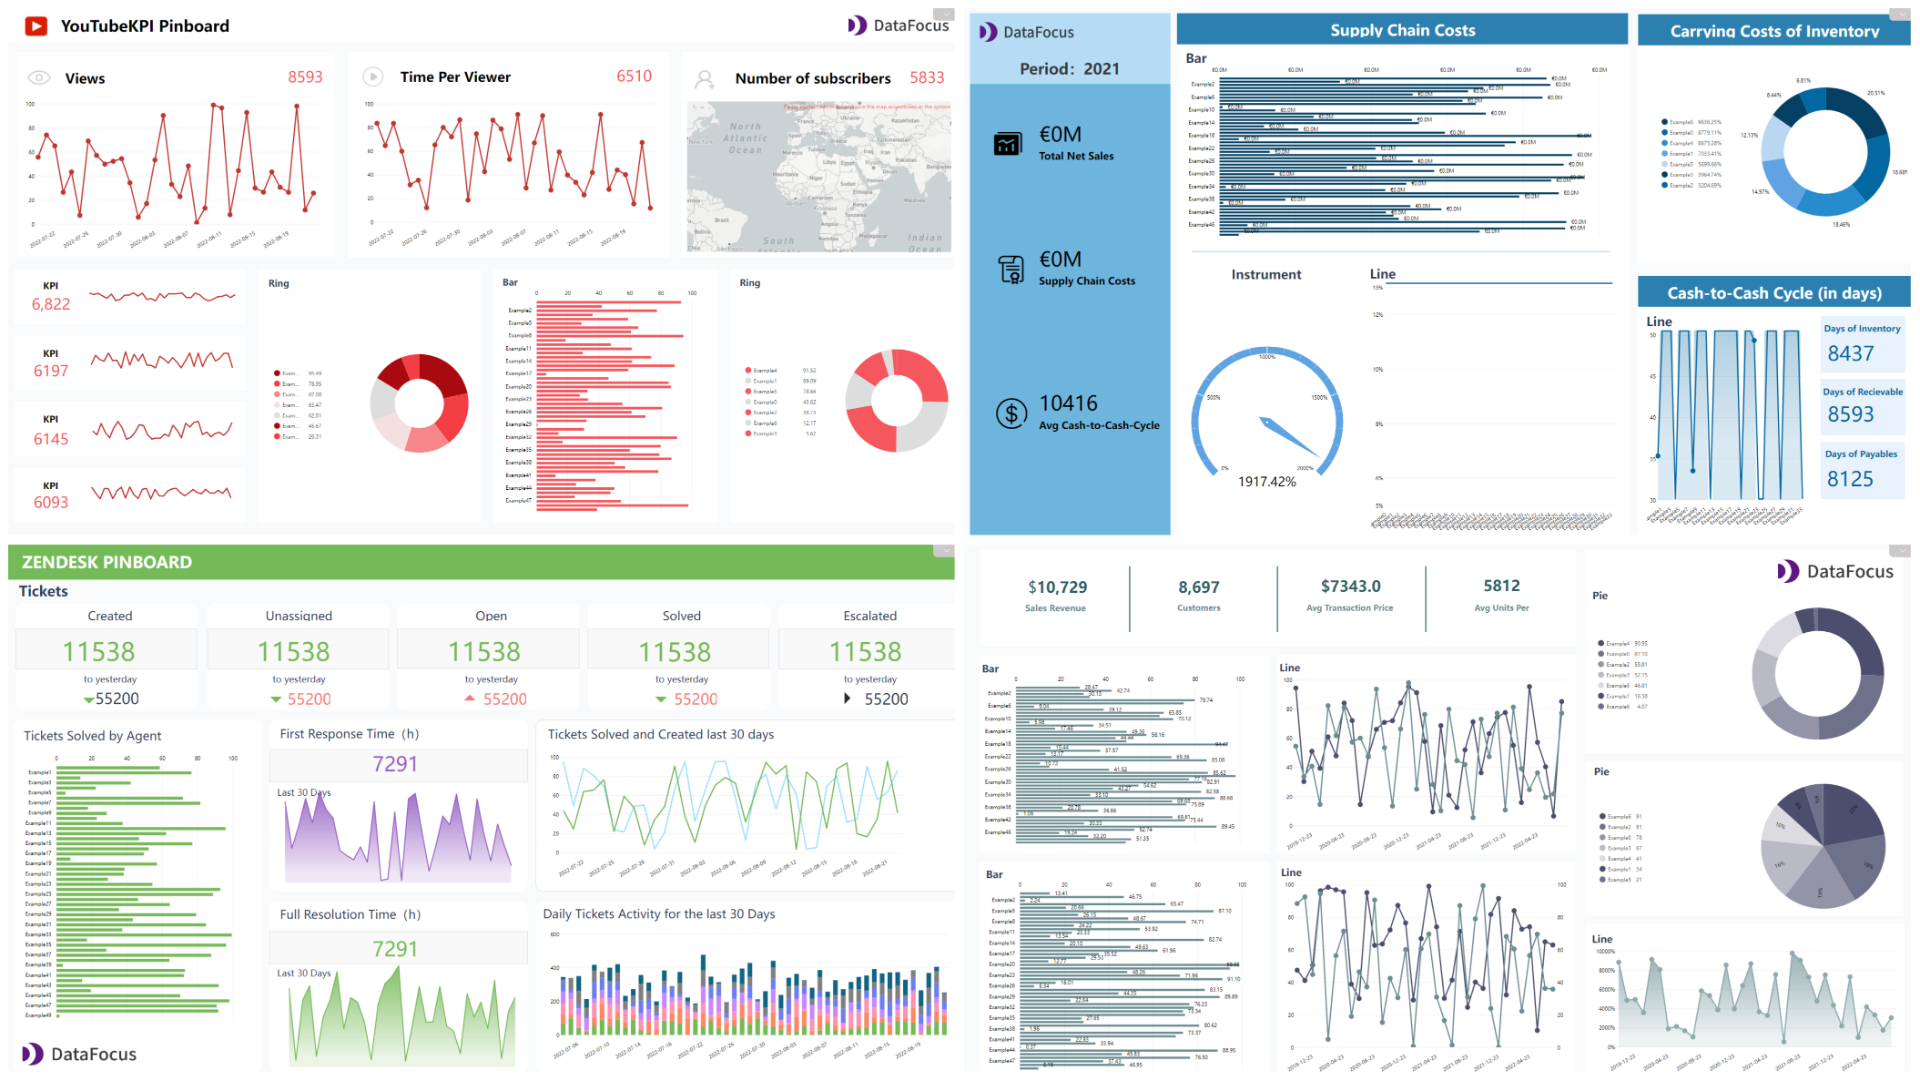
Figure 2-59 Dashboard templates
2.6 Resource Management
-
Tibco Cloud Spotfire
Resources such as data tables, dashboards are mainly stored with an analysis. As explained in section 2.1.4, analyses can be managed using folders through the “Files and data” flyout.
-
DataFocus Cloud
Resources including data tables, answers (charts), dashboards, etc are stored in different modules. Users can switch between different modules to check out resources. Under “Resource” module, all resources are listed. What’s more, tags are provided to help manage resources.
GIF Figure 2-60 Resource management - DFC
2.7 Collaboration
2.7.1 Comments
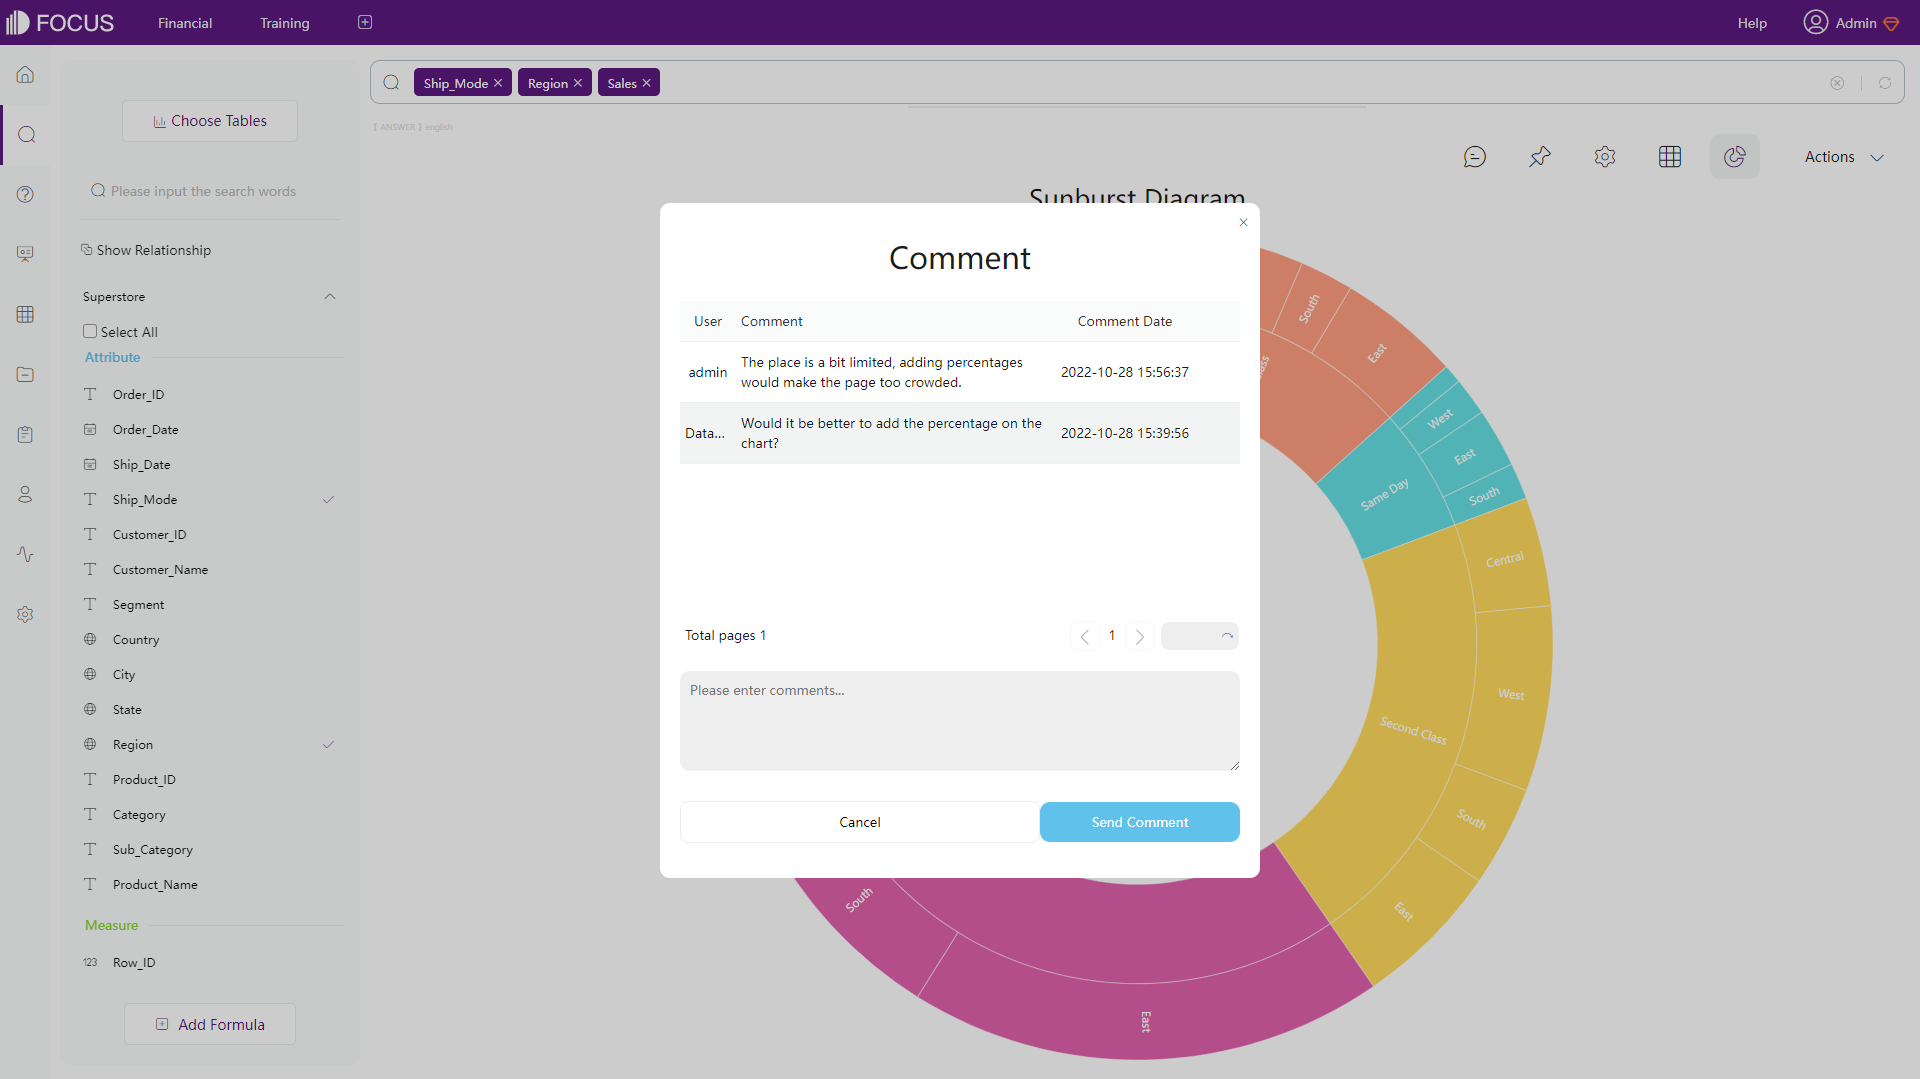
Tibco Cloud Spotfire and DataFocus Cloud both support comments. Users can add comments and communicate with each other, as shown below.
2.7.2 Roles
Roles are used in both systems to assign permissions for team members.
-
Tibco Cloud Spotfire
There are three kinds of roles, consumer, business author, and analyst. Roles here decides whether a users can edit analyses, what functionality a user can access, and etc. Note that one user can only have one role.
-
DFC
Roles have two types, system roles and custom roles. Roles can be assigned with permissions, and then members assigned with different roles can have different permissions towards different resources. For example, “Sales Manager” can edit any resource related to sales, while “Sales - Project A” can only edit resources related to sales in project A.
Whats’ more, Department structure can better help organize team members.
2.7.3 Share
-
Tibco Cloud Spotfire
Resources are mainly shared through folders, or users can export analyses as images or pdfs and then share.
There are four sharing levels, “Public” means that anyone can edit the contents, “Shared” means that contents are available only to selected group of people, “Private” contents are only available to the author, and resources in “Team folder” are shared within the entire team.
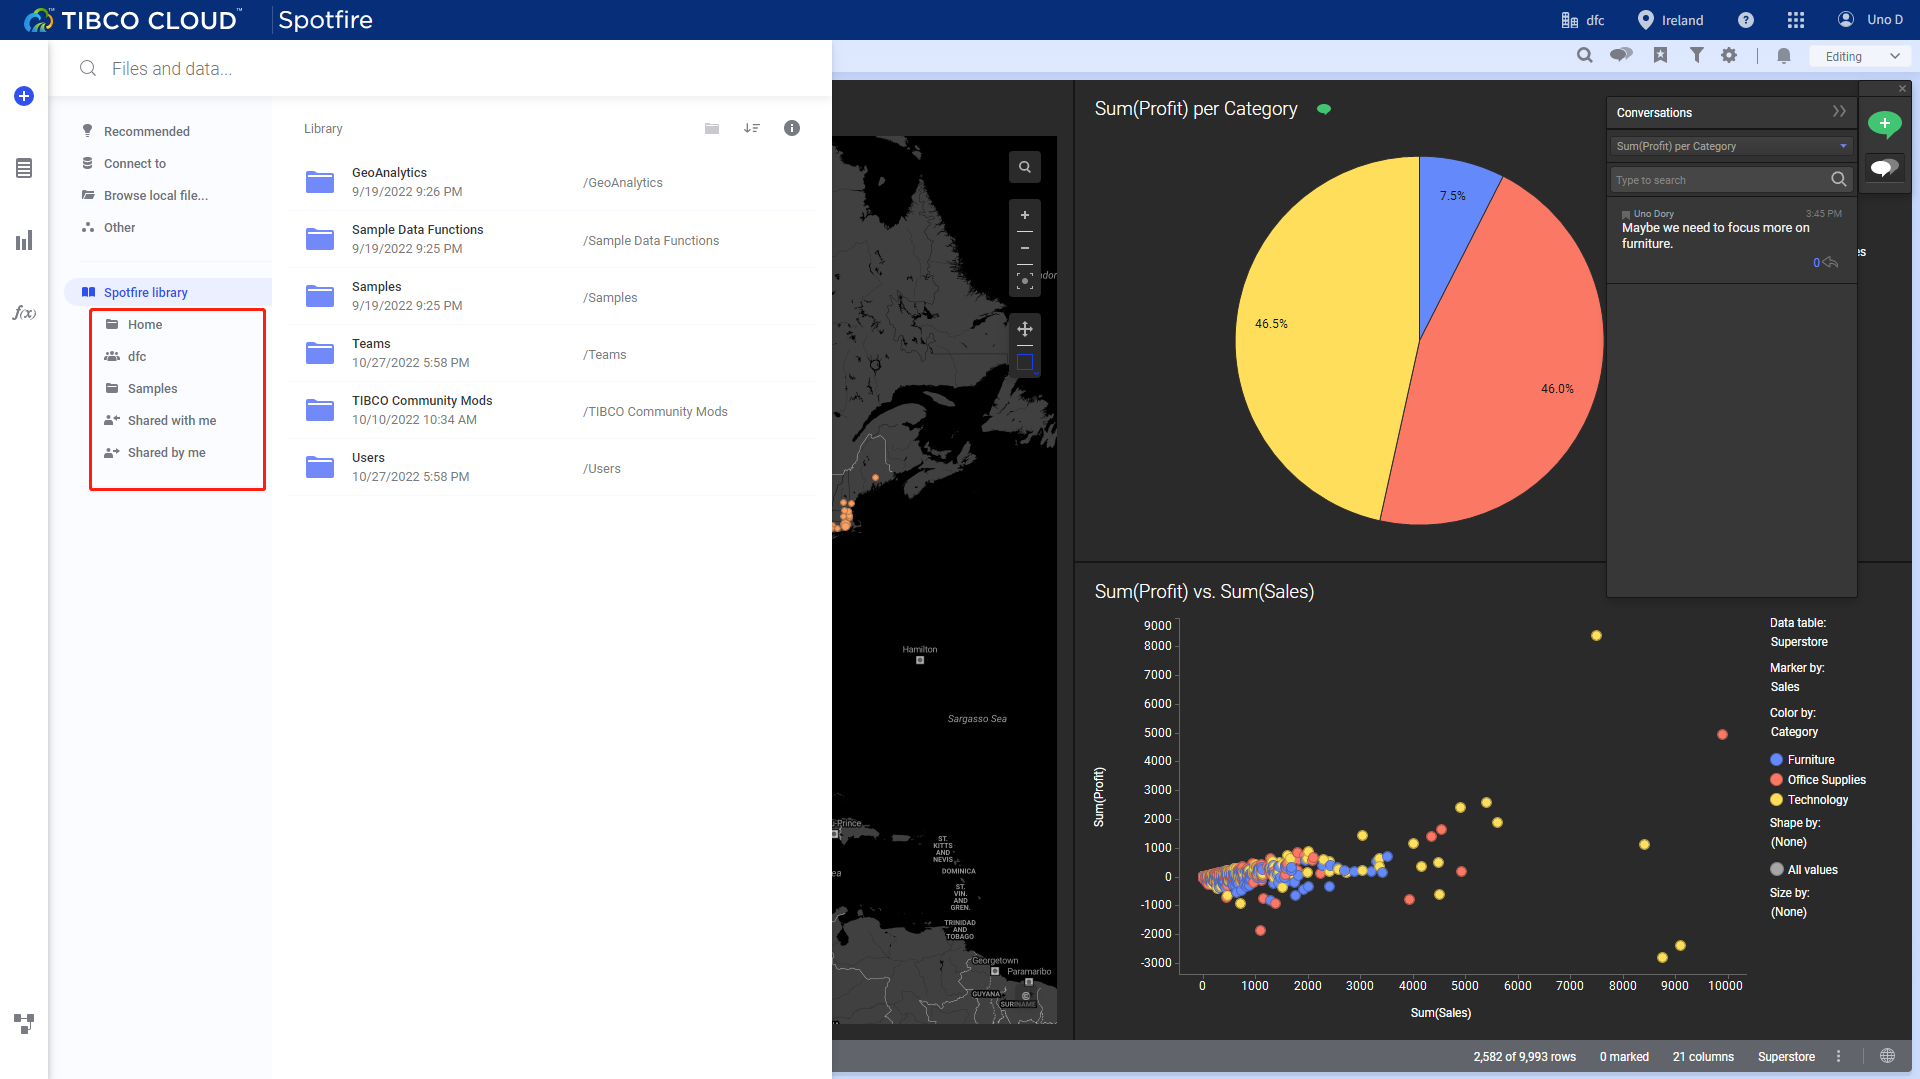
Figure 2-63 Share - Tibco Cloud Spotfire -
DFC
There are multiple ways to share in DFC, such as share within the system, export, using external viewing address, etc. One main way is sharing through roles. As explained before, different roles can be assigned with different permissions towards different resources. Combined with projects, it is very quick to share resources across the team.
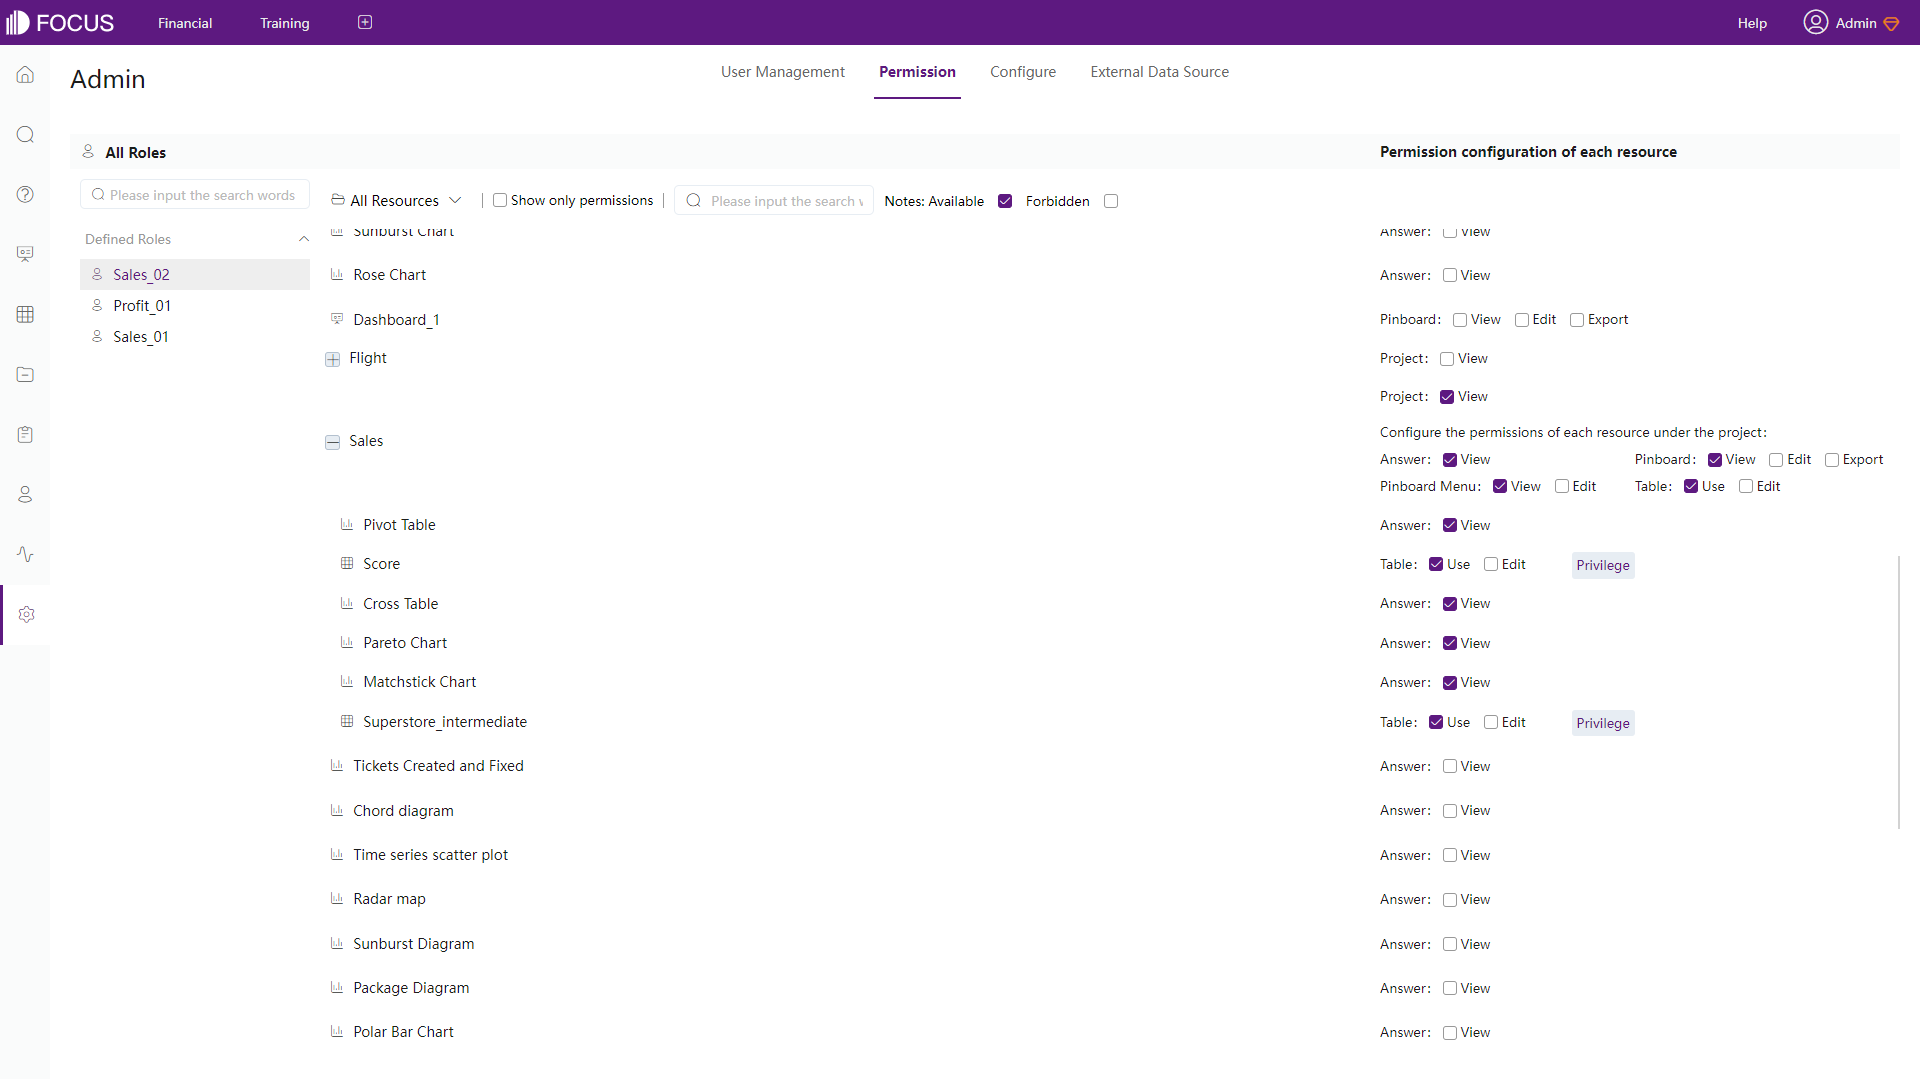
Figure 2-64 Roles - DFC
2.8 Cost
Tibco Cloud Spotfire’s charging plan is according to roles and capacity. Each user needs to purchase a role, which is expensive for teams and is difficult to spread among large number of users. Costs would increase linearly, and it is hard to assess them.
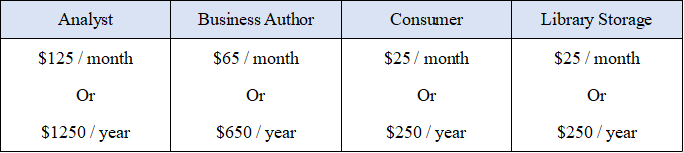
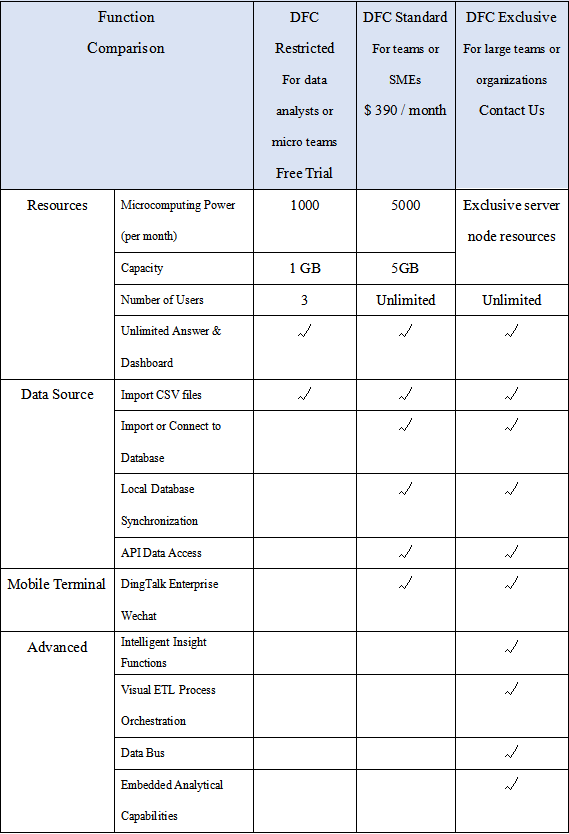
DataFocus Cloud charges by capacity, and thus number of members are not very important. Teams would find it fairer and easy to disseminate. The pricing plan is as shown below.
3. Conclusion
The two BI products provide immersive visualization analytics to help make data-driven decisions. The similarities and differences between Tibco Cloud Spotfire and DataFocus Cloud are explained in this article.
Tibco Cloud Spotfire provides convenient visualization operations through flyouts. Using pages, users can quickly switch between different dashboards. Also, functions from libraries can help get inspirations about analyzing data.
DFC provides a comprehensive system to conduct search-based analytics that helps business elites better understand the values of data. Teams can collaborate easily throughout the extensive system. DataFocus Cloud will continue making users experience better. Try out here: DFC.
