ThoughtSpot vs DataFocus Cloud
Search-based analysis truly helps business elites achieve self-service. Starting from thinking as a user, it turns business questions such as “Which parts of your business are not profitable?” into actionable insights. ThoughtSpot and DataFocus Cloud (DFC) are leading the new era of search-based analysis.
With a fairer cost, DFC has a more comprehensive system for collaboration, a higher degree of customization across visualizations, and more abundant visualizations.
Though the two tools have many similarities such as the way of searching and the usage of formulas, there are still a lot of differences. Read to help select the one more suitable for you.
1. Introduction
ThoughtSpot aims at creating a more face-driven world with its easy-to-use analytics platform. It is a modern analytics cloud tool to help build business on data.
Similarly, as a SaaS (software-as-a-service) platform, DataFocus cloud provides easy data analytics as well as data visualization on cloud. Targets on turning business elites into data experts, DFC interprets human language into exquisite visualizations.
2. Comparison
2.1 Interface
2.1.1 Home Page
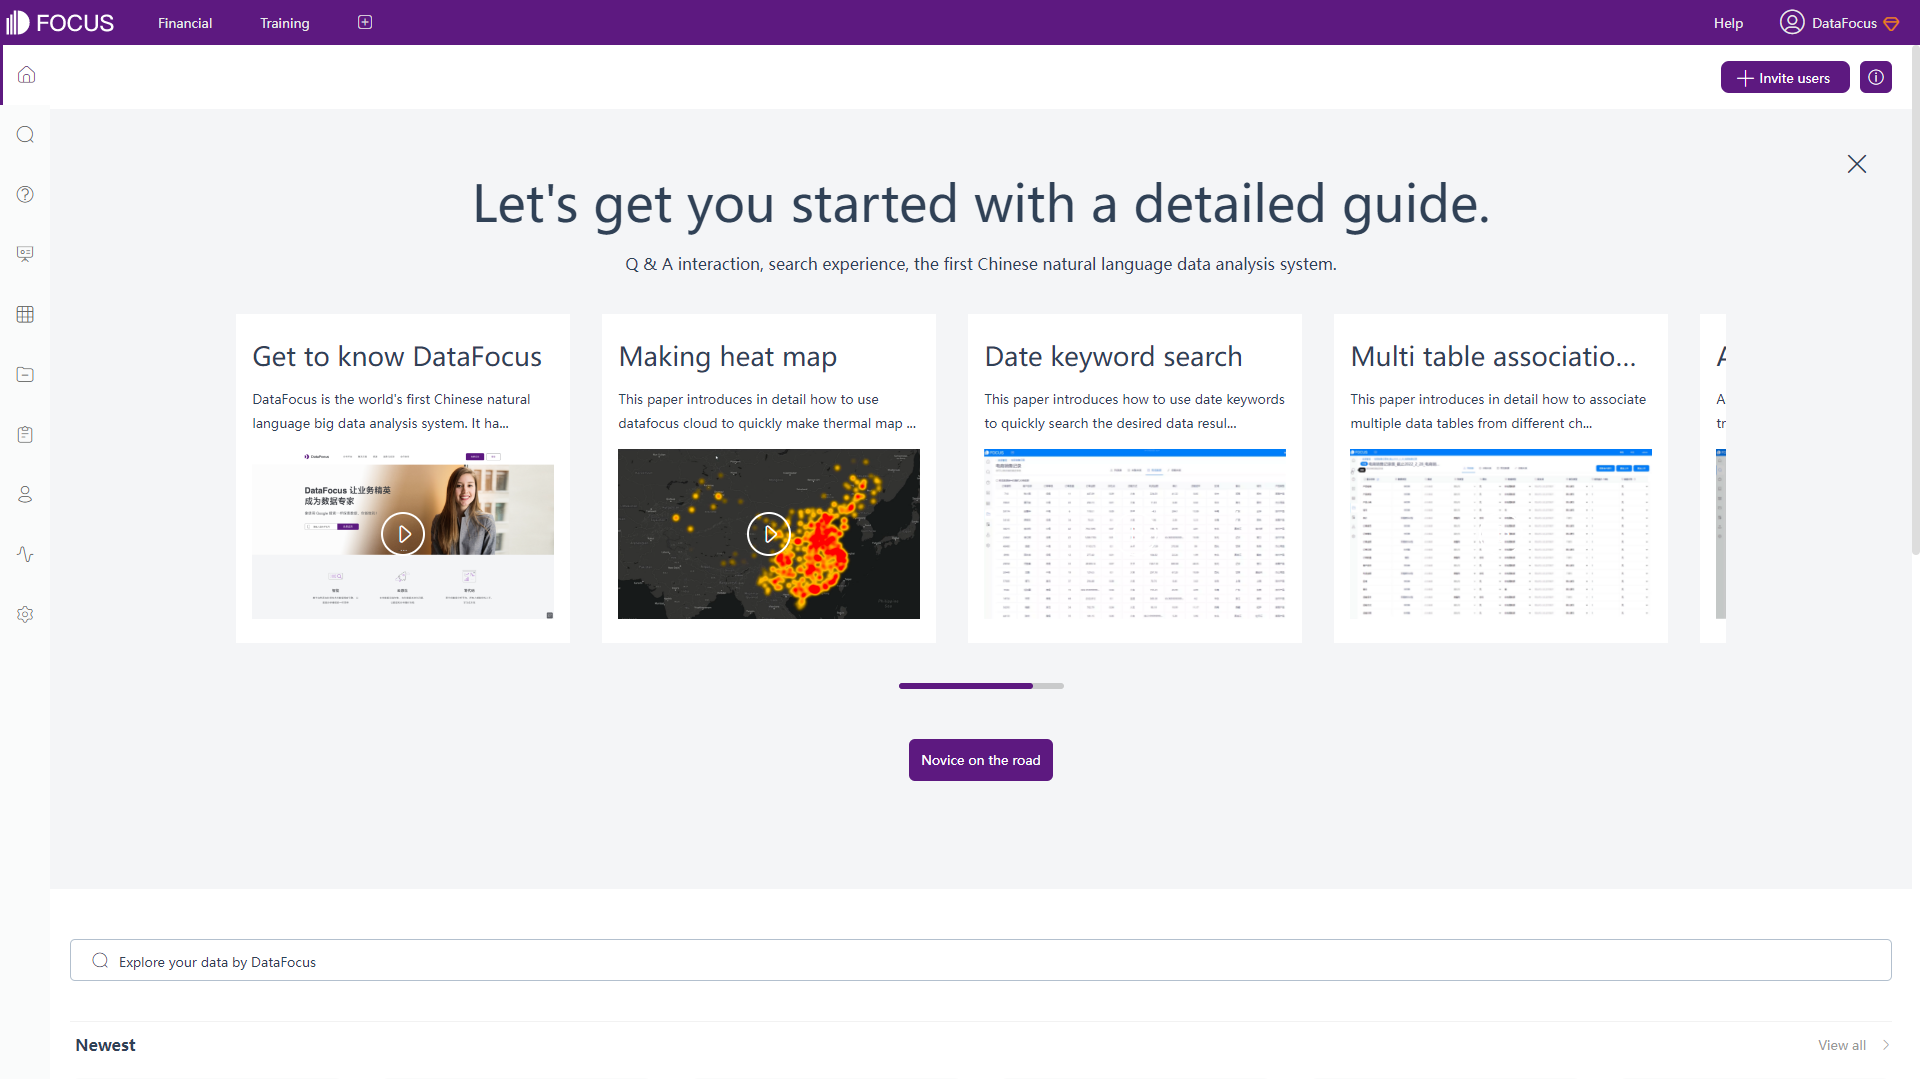
For new users, ThoughtSpot provides tours to help them better understand and utilize the system. Users can revisit tours through the information center in the top right corner. As shown in figure 2-1, DFC utilizes a guide window for beginners to learn how to use the platform, including how to search keywords, create charts, etc.
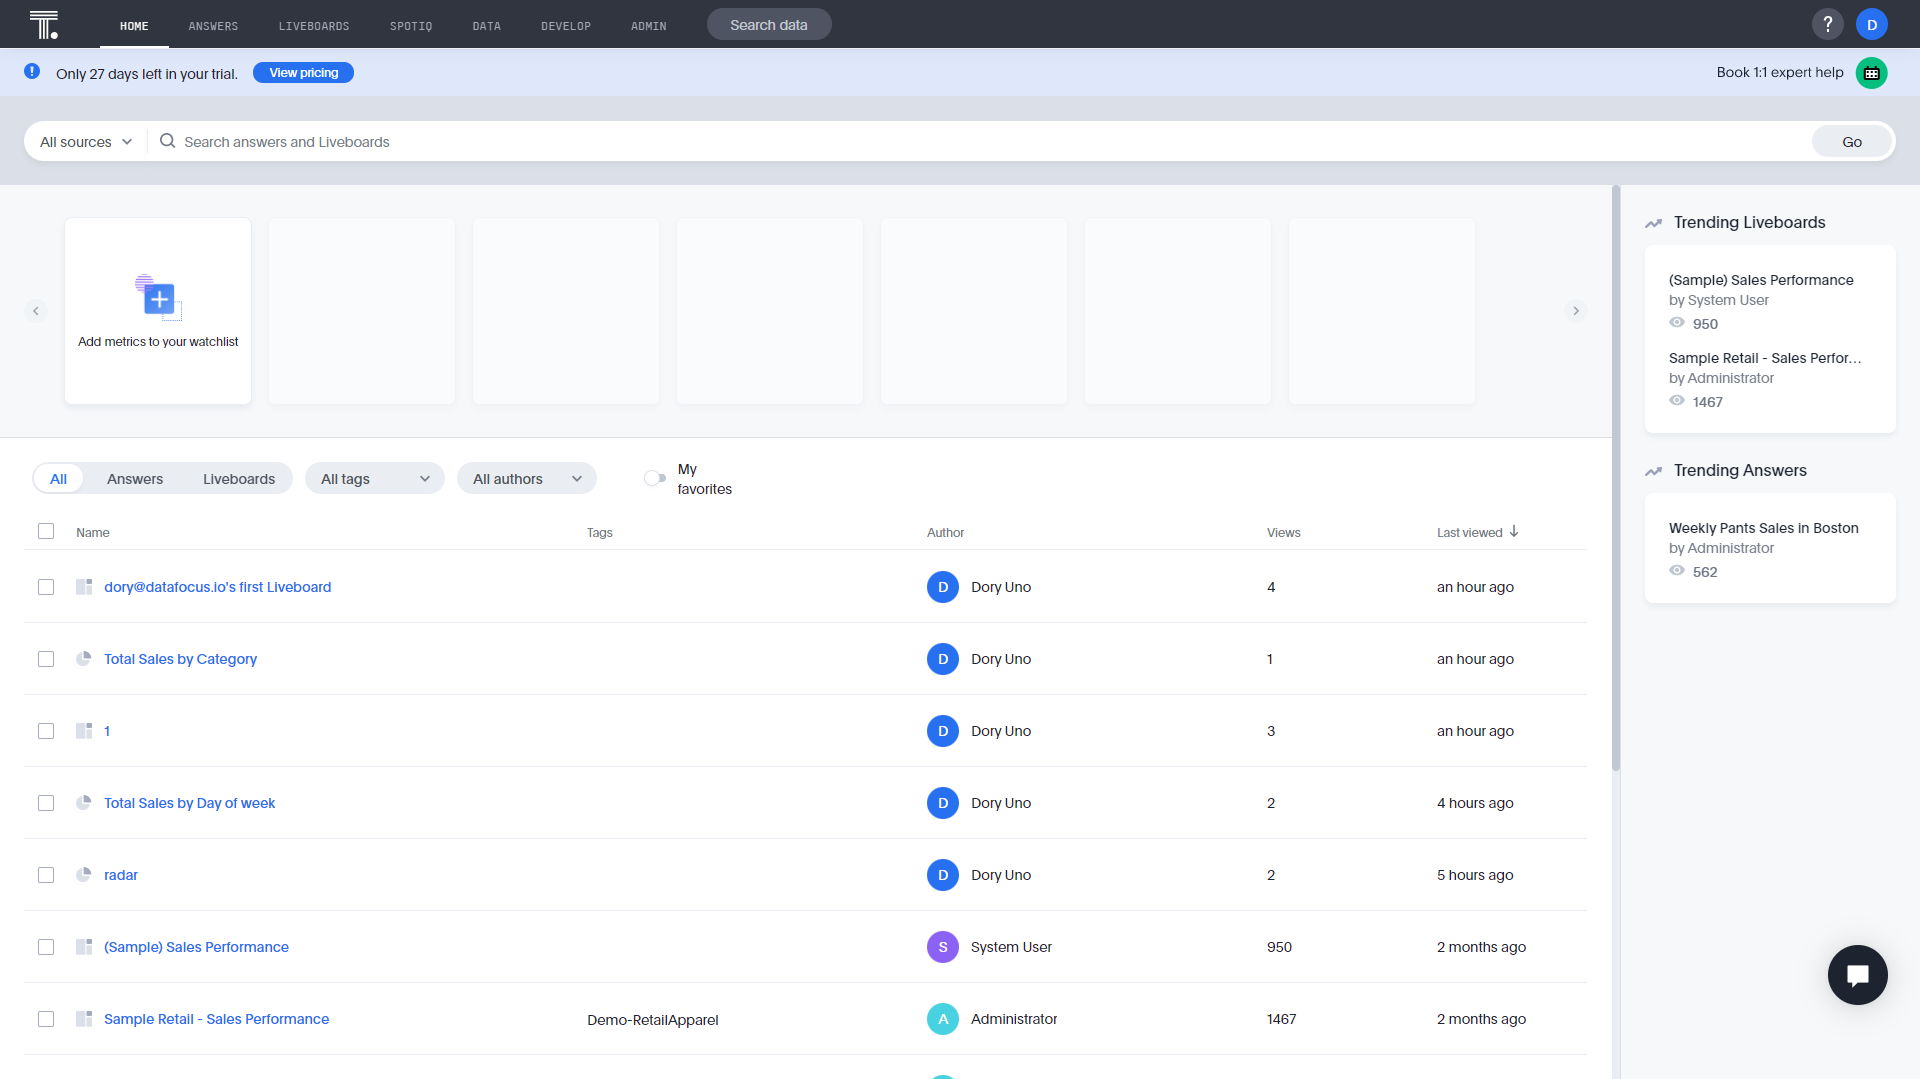
The home page of ThoughtSpot mainly displays resources, metrics, and trending liveboards & answers, as shown in figure 2-2. Users can track important metrics, search resources, etc on the home page.
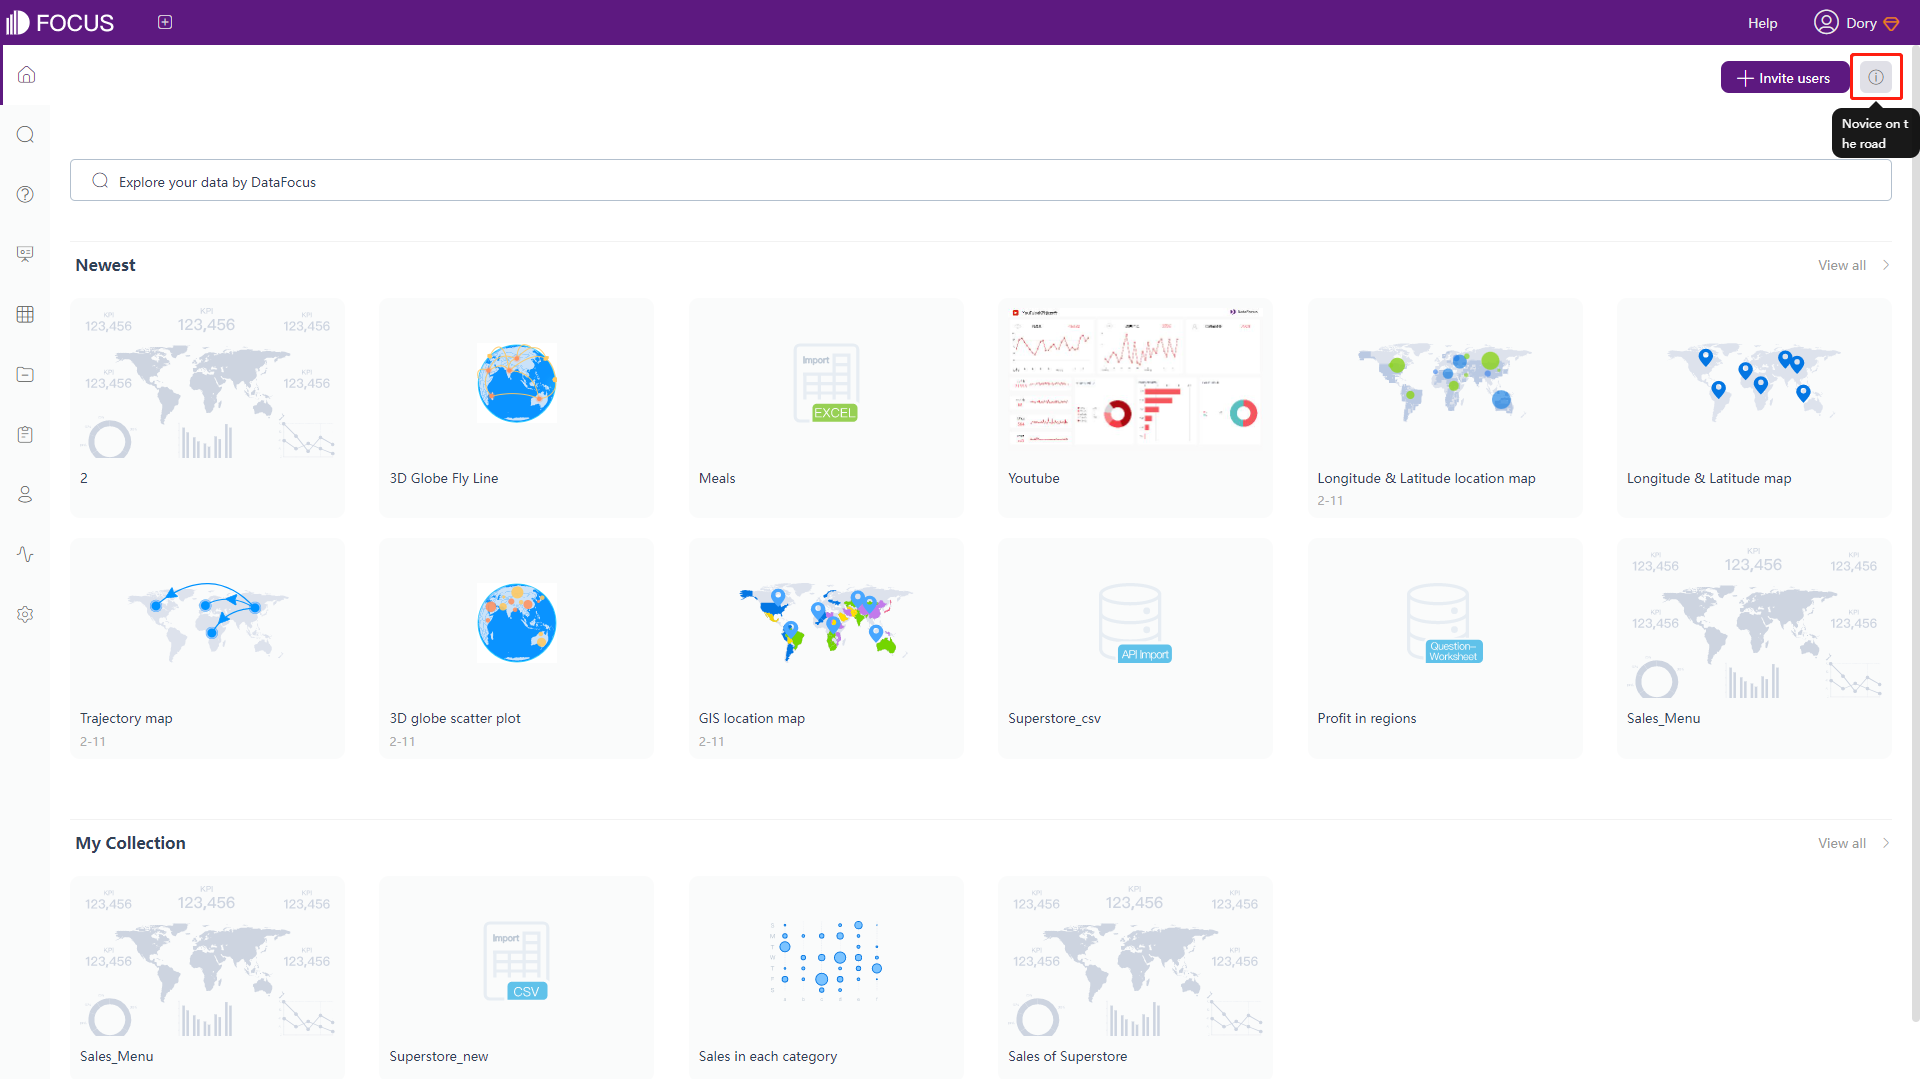
The home page of DFC mainly lists resources, as shown in figure 2-3. The guide window can be opened anytime through the “novice on the road” button on the top right corner. Also, users can invite other members here.
2.1.2 Data Page
The detailed page of data tables shows information relevant to the table. As shown in gif figure 2-4, ThoughtSpot lists information of columns, joins, data sample, summary statistics, and dependent answers/liveboards.
As shown in gif figure 2-5, DFC displays information relevant to columns, relationships (join), preview, and dependent answers/dashboards. DFC offers more geographical types and parent columns to form the index of a tree. Also, users can quickly append or overlay data here.
2.1.3 Search Page
Both ThoughtSpot and DFC divide the search page into 3 parts: column information, search bar, and visualization. The difference is:
-
Do, Undo, Reset
ThoughtSpot offers these options, so that users don’t have to re-search when they prefer the previous search.
-
Column Type
DFC displays small icons in front of the column names to show the type of column. The types include text, time, geographic, and number, as shown in figure 2-6.
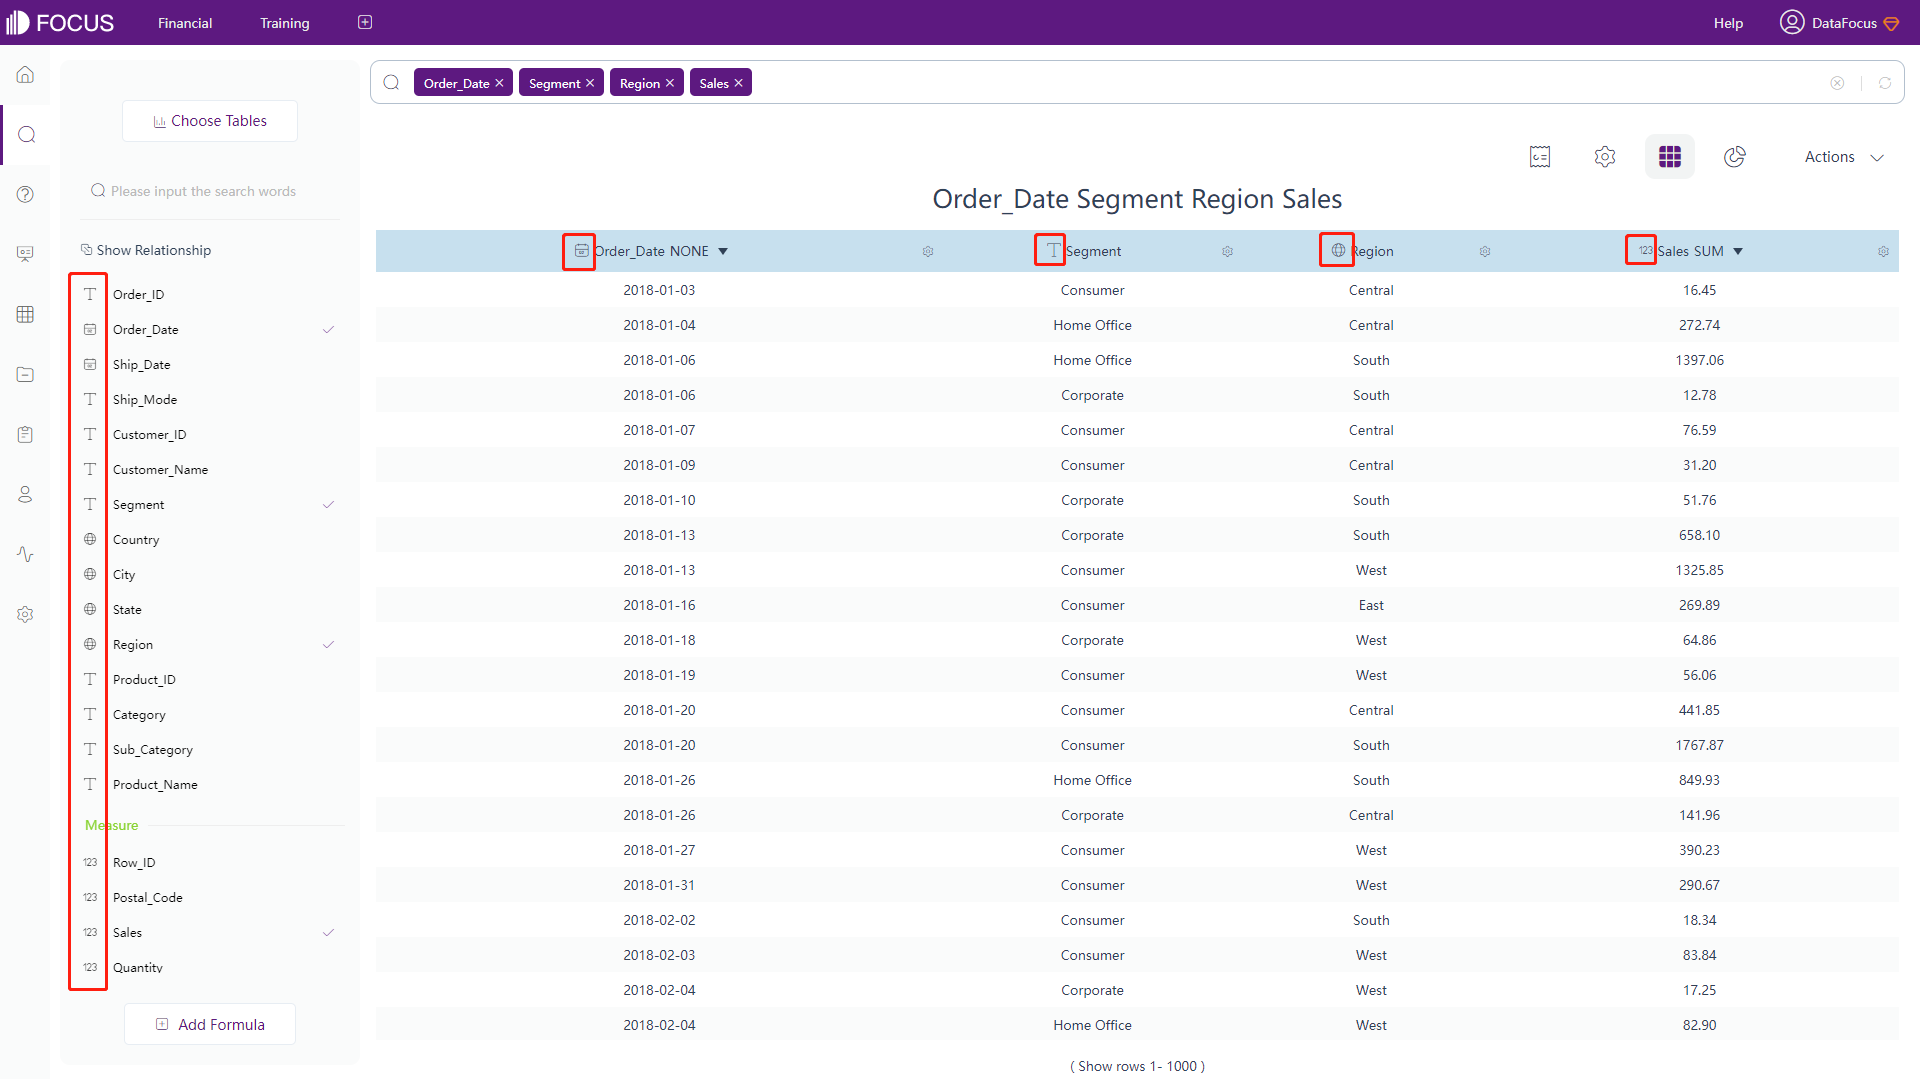
Figure 2-6 Column types -
Column Display
Column names are arranged in alphabetical order in ThoughtSpot, while they are organized as attributes and measures in DFC. The latter display is easier to classify attributes and measure.
2.1.4 Resource Page
-
Tags
Tags are applied in both ThoughtSpot and DataFocus Cloud to quickly classify resources. The difference is ThoughtSpot uses texts as tags and DFC uses texts as well as color dots, as shown in figure 2-7 and gif figure 2-8.
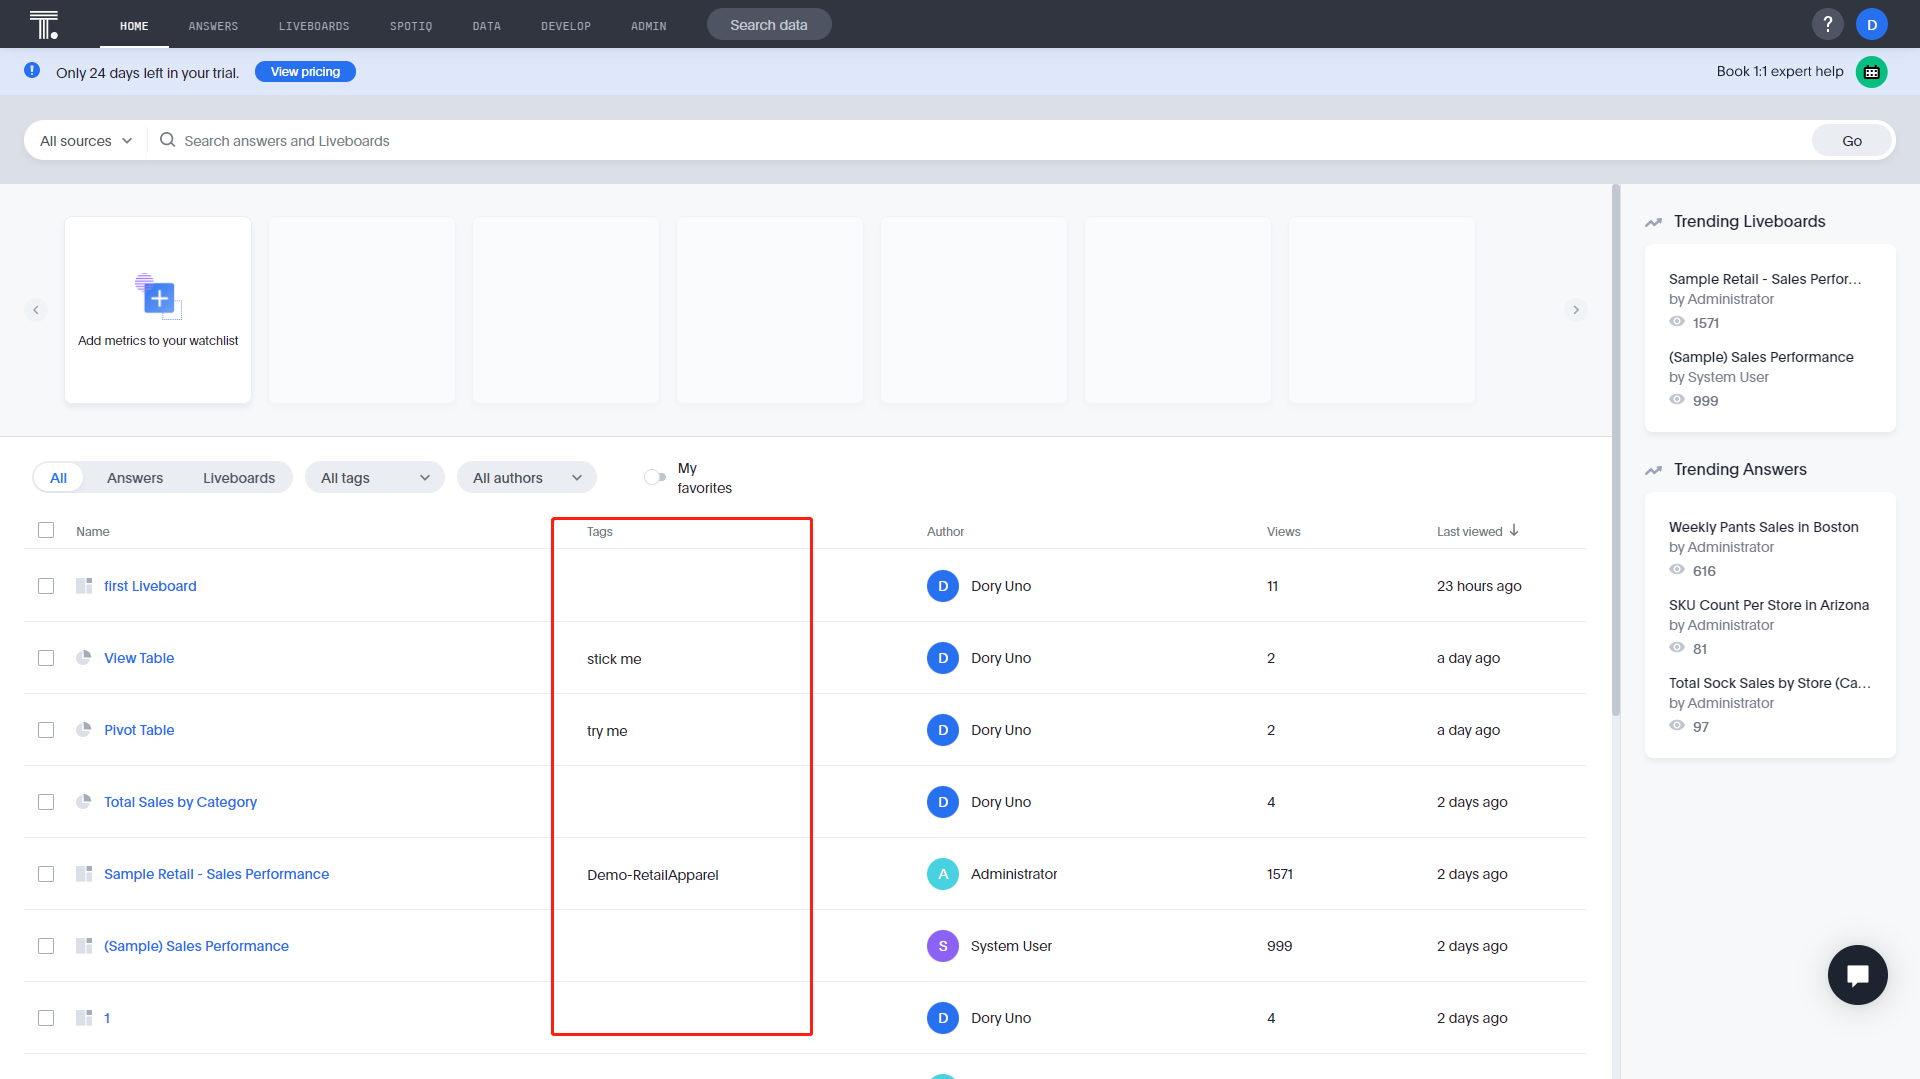
Figure 2-7 Tags - ThoughtSpot 
GIF Figure 2-8 Tags - DFC -
Resources
All of the resources (answers & liveboards) of ThoughtSpot are listed on the home page, while DFC uses a separate resource module to display resources, including projects, answers, dashboards, and tables. Also, DFC provides 2 different kinds of display methods: list and thumbnail to fulfill different viewing needs, as shown in gif figure 2-9.
GIF Figure 2-9 Display modes -
Operations
On the home page of ThoughtSpot, users can share, delete, and mark resources as favorites. While on the answers/liveboards pages, users can also apply tags, export TML, and edit TML, as shown in figure 2-10.
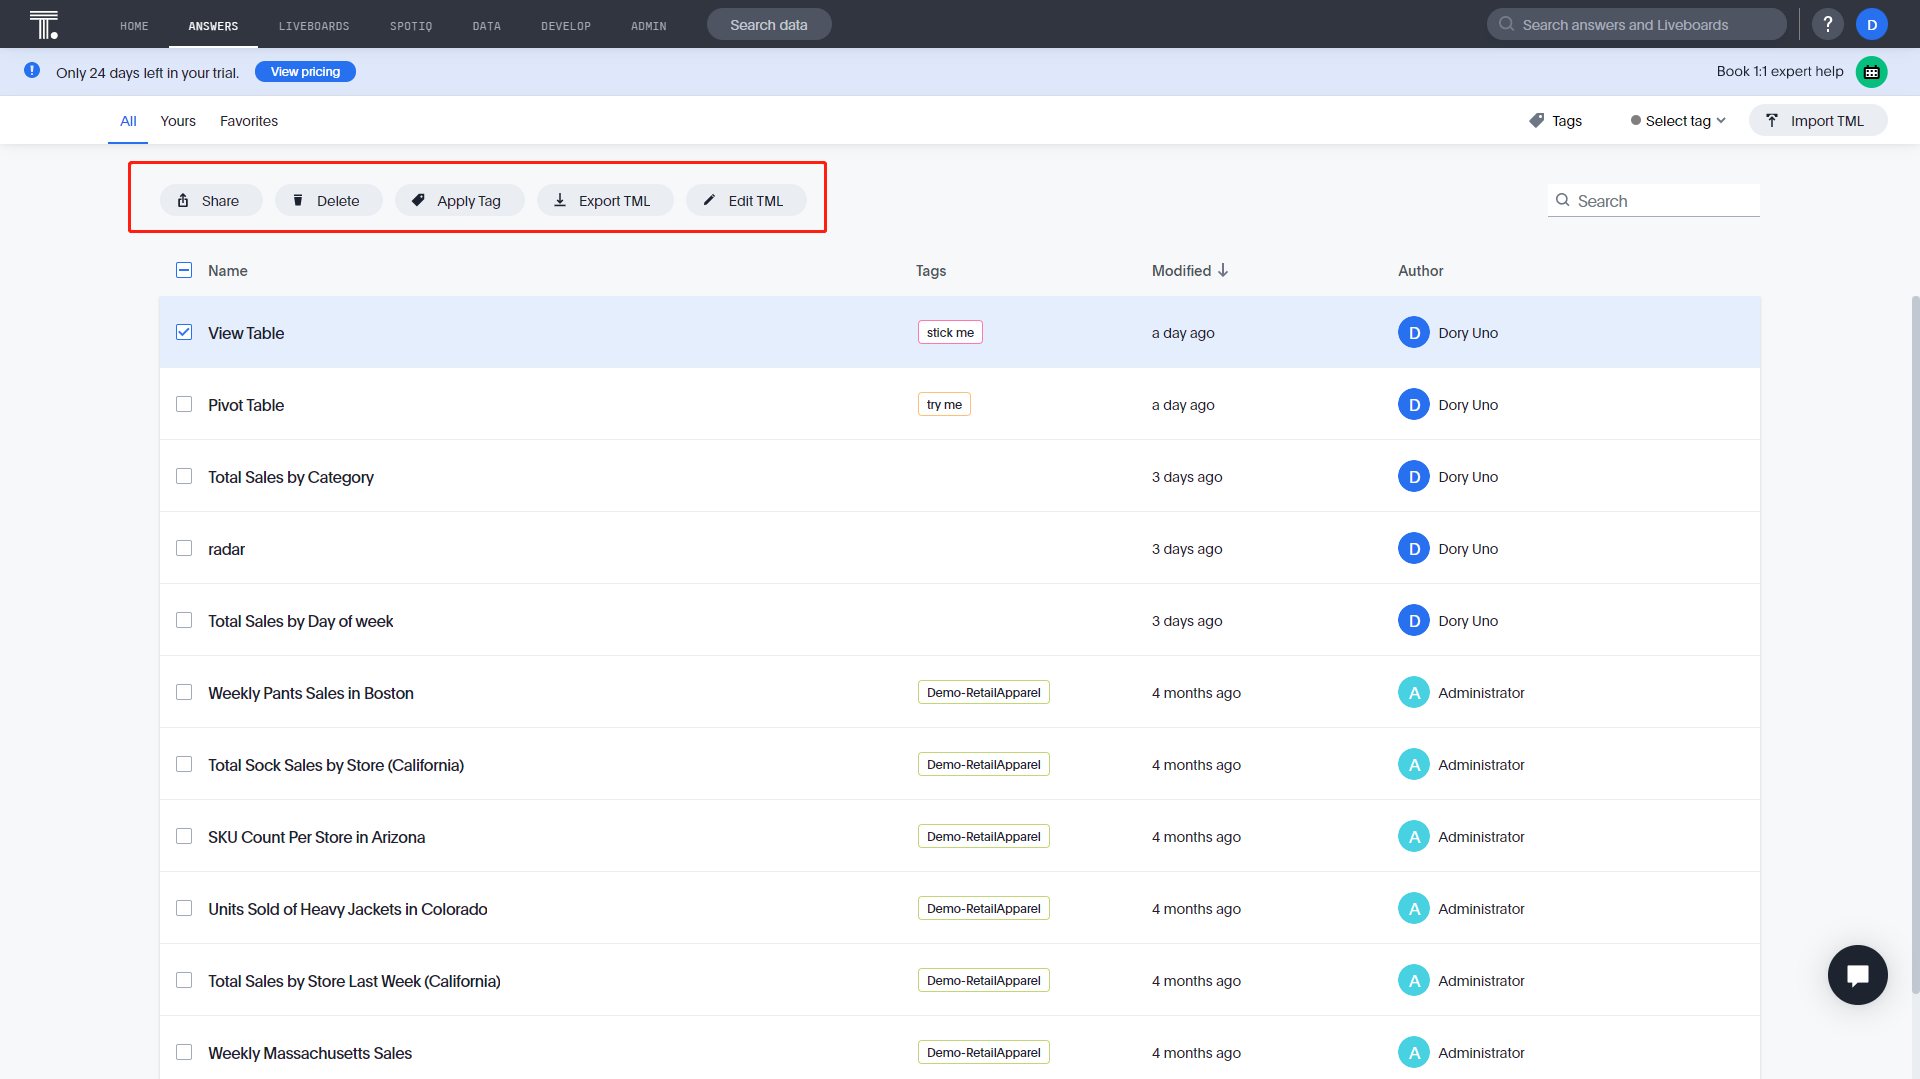
Figure 2-10 Operations - ThoughtSpot Users can move, delete, export, apply tags, share, collect, make public of, and change the owner of resources on the resource module in DFC, as shown in figure 2-11.
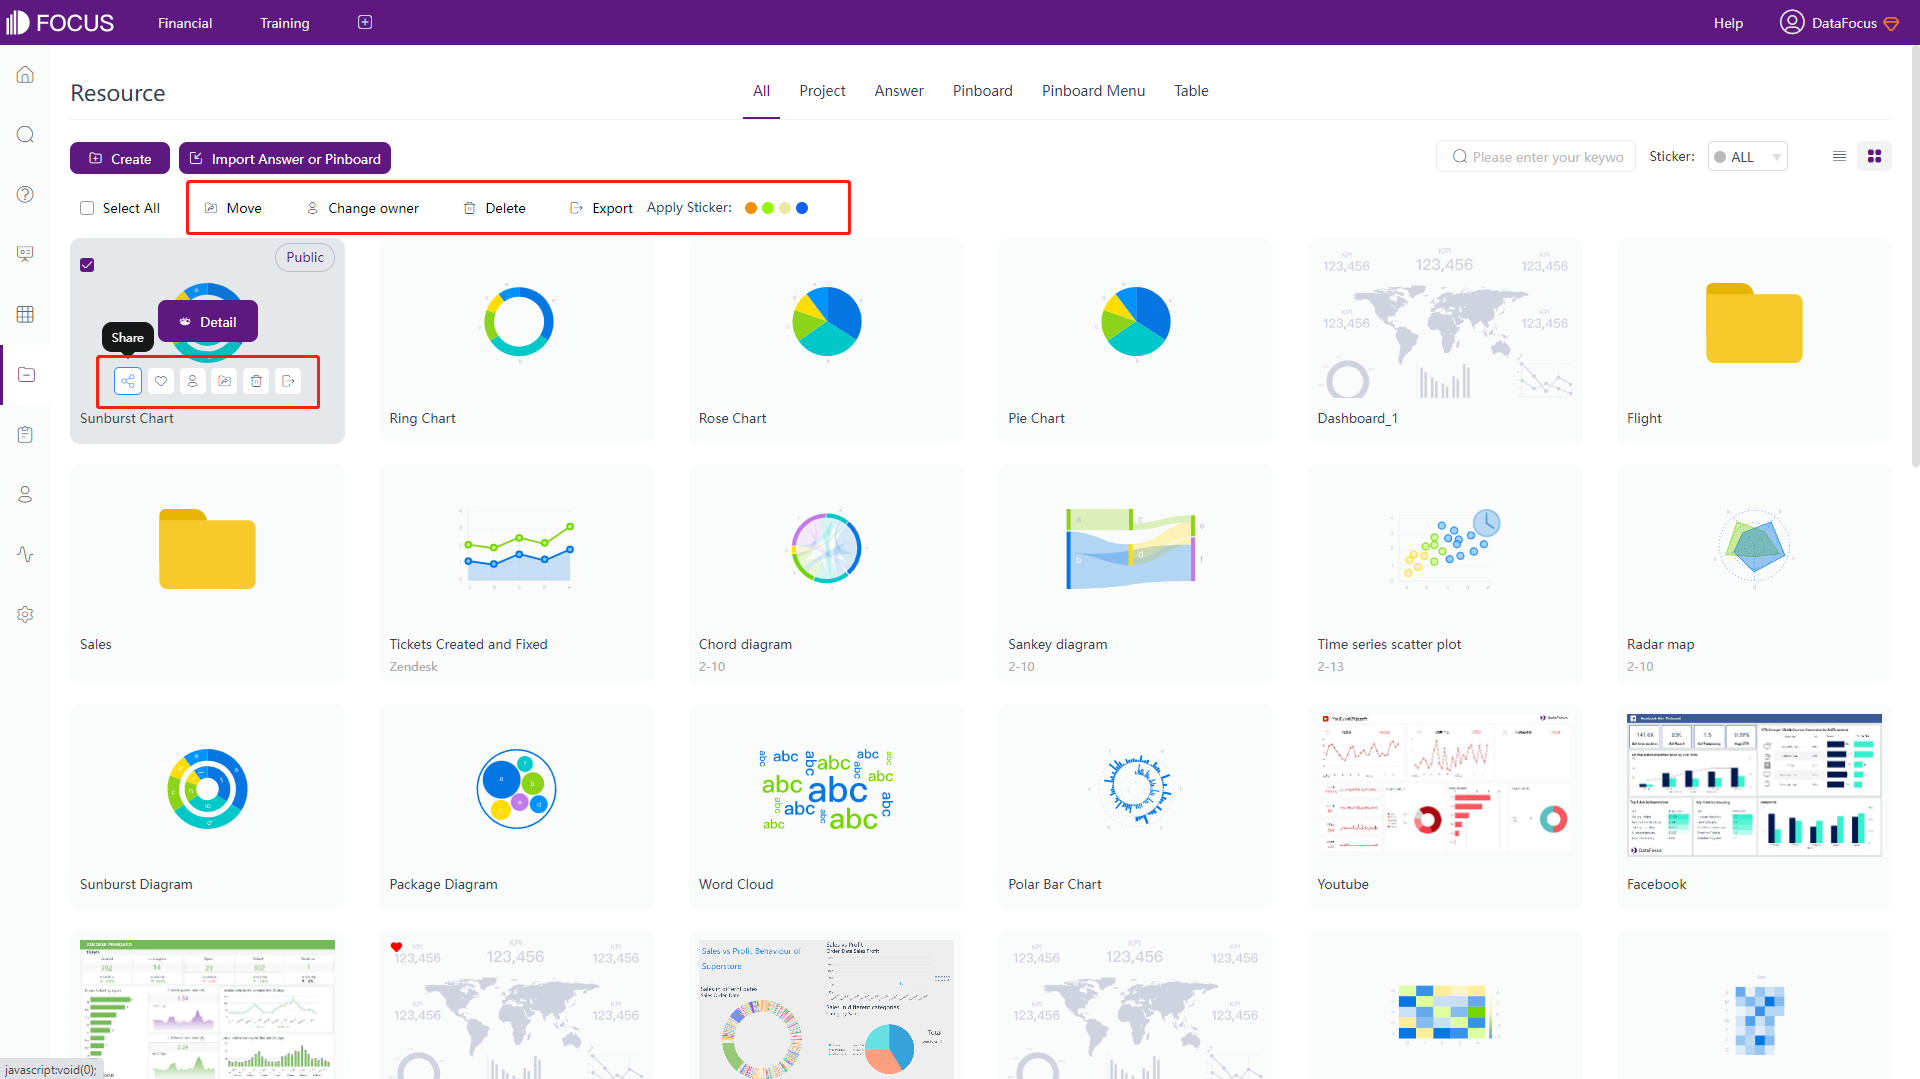
Figure 2-11 Operations - DFC
2.1.5 Navigation Bar
The navigation bar of ThoughtSpot lies on the top, while it lies both on top and left on DFC.
There are 8 different modules in ThoughtSpot and 10 in DFC. Other than home, search, resources, and admin/user center page, ThoughtSpot also has a “SPOTIQ” page to help automatically analyze data, and a “DEVELOP” page to build interactive data apps. DFC provides a log module to view operation logs, a data module to view the usage analysis of the resources and access API, and an admin page to set configurations of different resources as well as management.
Dashboards can be pinned on the top navigation bar of DFC. Therefore, users can quickly access those important dashboards at any time, as shown in gif figure 2-12.
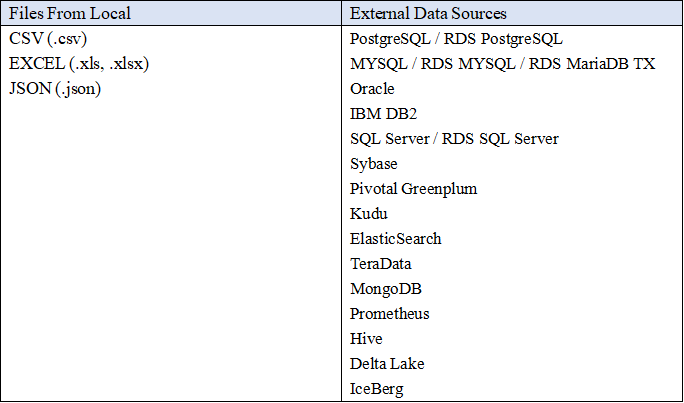
2.2 Data Source
In the free trial of ThoughtSpot, users can upload 1 flat data file (CSV) with a limit of 10 M, or connect to cloud data warehouse, such as Snowflake, Amazon Redshift, etc.
DataFocus Cloud provides 4 ways to get data, and the free trial only limits the capacity, rather than the way of requiring data:
- Import local files (several file types) with a limit of 500M;
- Upload data warehouse, which fits big data scenes like billions of data;
- Connect to databases. DFC is a data warehouse here, and updates resources in real-time. Moreover, different databases can be connected at the same time. Then users can join-analyze data tables from different databases concurrently;
- Use API to access data after licensing external resources;
Below are the source types supported by DFC.
2.3 Ease of Use
2.3.1 Search
The difference in interfaces is described in section 2.1.3.
Both ThoughtSpot and DFC can use multiple data tables here. Also, the ways of adding columns are similar: typing in the search box, double-clicking the column names and using the adding button.
The main difference is that ThoughtSpot will highlight the search bar and the data pane. Users need to click “Go” or the unhighlighted area to confirm the search. DFC does not set up highlights, the system will automatically return the result after the selection of columns.
Another difference is that in DFC, column names on the search bar can be moved to change orders, and some visualization charts will change accordingly, such as tables. The order of column names can not be moved directly in the ThoughtSpot system, users need to re-enter the search bar or drag the columns in tables.
2.3.2 Keywords
ThoughtSpot and DFC both provide a series of keywords, including time, string, rank, etc.
DFC supports more abundant keywords, for example, top 2 to 5, growth amount, first 5 days for each month, etc.
2.3.3 Filter
The two tools both support filtering through keywords, adding filters on table, axis of charts, and liveboards/dashboards. Also, users can add filters in batches. The differences are:
-
Select
DFC also supports filtering directly in the charts, clicking and selecting areas to include data. Then clicking the “Reset” button to make the hidden data show up again, as shown in gif figure 2-17.
GIF Figure 2-17 Select to include -
Filter Form
The filter forms are basically the same. DFC also provides the min&max values of time and measures to help users determine the boundary. In terms of attributes, DFC provides an option of “Exclude the empty value”.
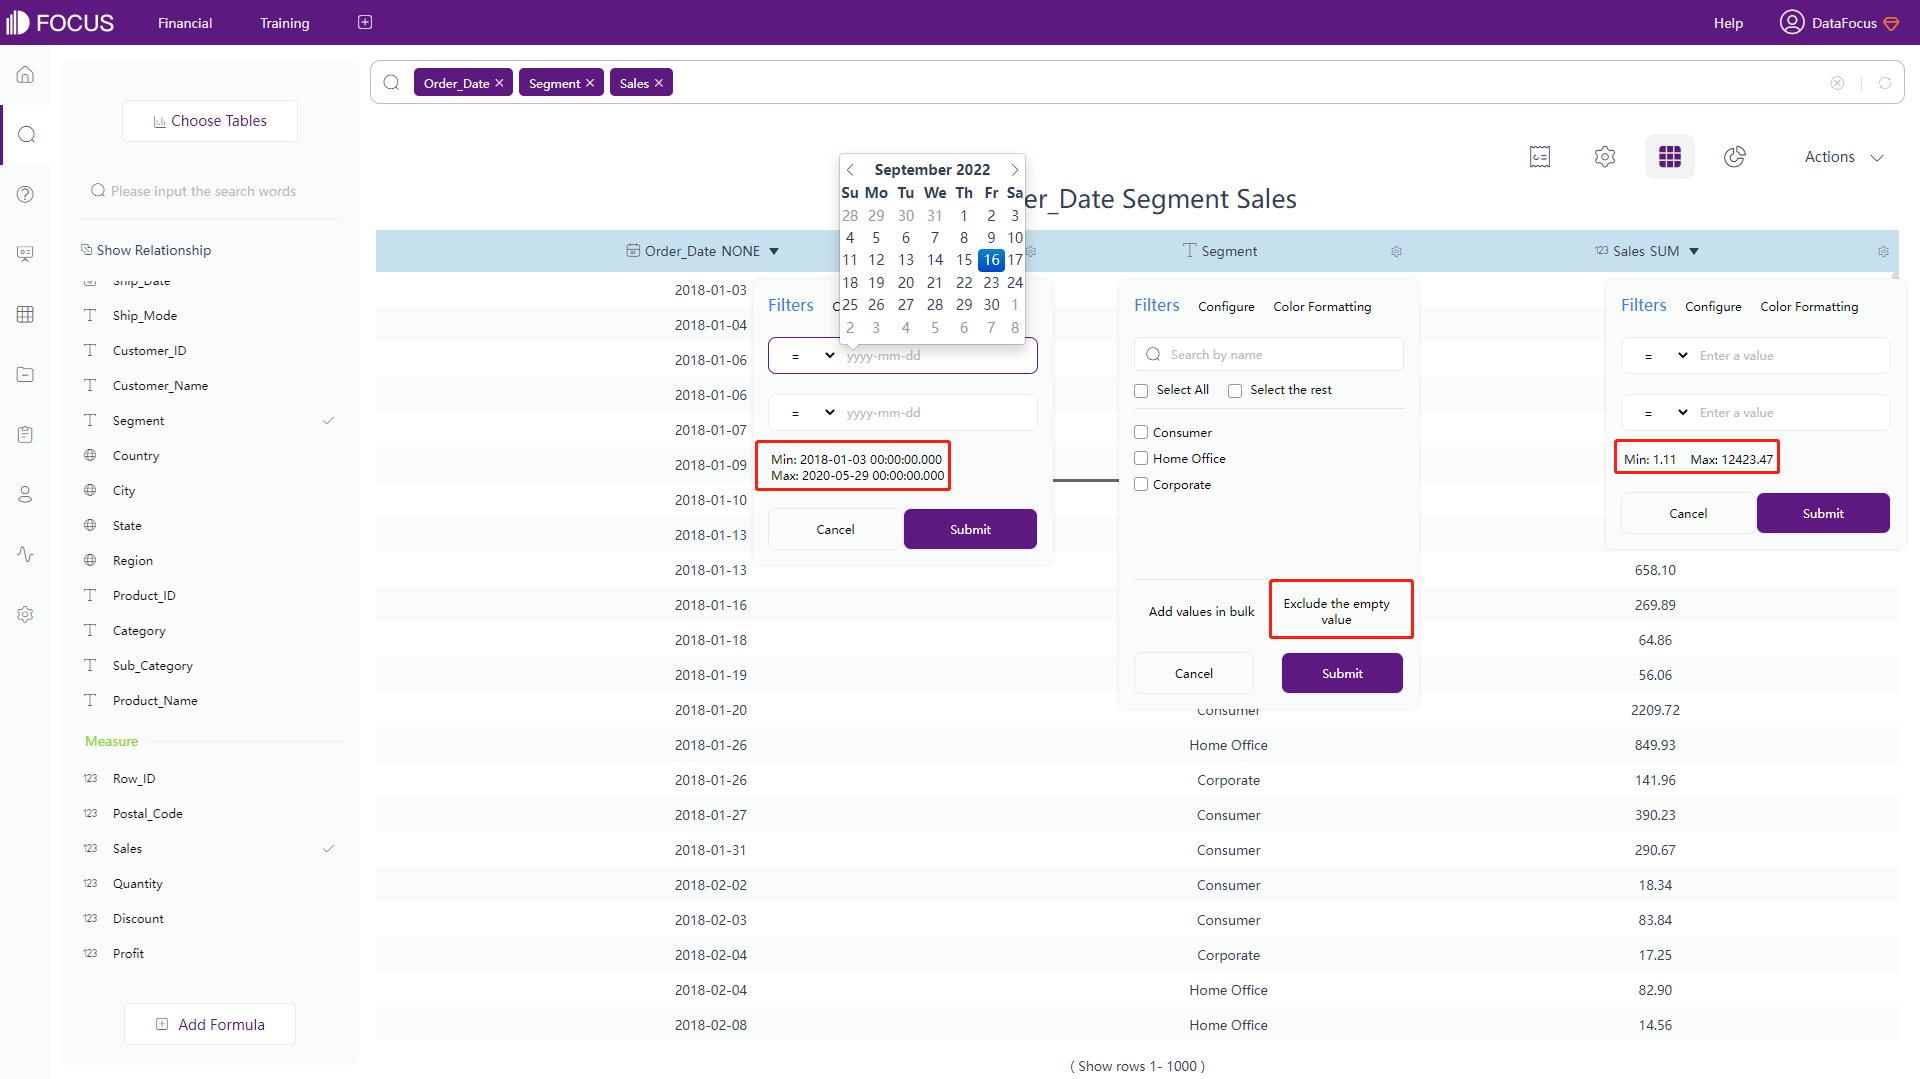
Figure 2-18 Filter form -
Filters on Liveboards/Dashboards
Under the editing mode, users can add filters on ThoughtSpot’s liveboards. Though users may not have the privilege to add filters under a free trial.
On the viewing page of DFC’s dashboards, by clicking the data point or selecting an area of a graph, all of the charts will be filtered concurrently, as shown in gif figure 2-19. The effect can be removed by clicking the “Revert” button.
GIF Figure 2-19 Filter - dashboards
2.3.4 Formula
Formulas can be added through the search box or the formula editor, and formulas can be nested, that is, formulas can be used within another formula. ThoughtSpot and DFC offer various types of formulas, including conversion, aggregation, time, etc. Also, with formula assistant, users can write formulas easier and quicker.
For users’ convenience, DFC utilizes prompts to help write formulas even quicker (syntax is also prompted). DFC’s entire formulas are displayed here: formula list.
2.4 Data Processing
To process data, both ThoughtSpot and DataFocus Cloud create nested queries using a view/intermediate table. Also, join can be applied on views/intermediate tables.
DFC has two different kinds of intermediate tables: intermediate answer table and intermediate join table. The former one is created through the search-analysis page, and shows measures in aggregation, while the latter one is created on the table module or the resource module and displays the data the same as the original data table.
What’s more, DFC provides some advanced data transfer:
-
Conversion Between Rows & Columns
Rows and columns can be converted freely without complex formulas or operations, and the conversion effect can be removed at any time.
GIF Figure 2-20 Conversion between rows&columns -
Split Columns
The number of columns after splitting (split number) and split delimiter are customized. Therefore, users can split the columns as they want. Also, the structure of the data table will not be changed.
-
ETL Tool
DFC has its own ETL tool to extract data from different sources.
2.5 Visualization
2.5.1 Table
-
Types of tables supported by both tools:
-
View Table / Grid Table
Table shows data in two-dimension.
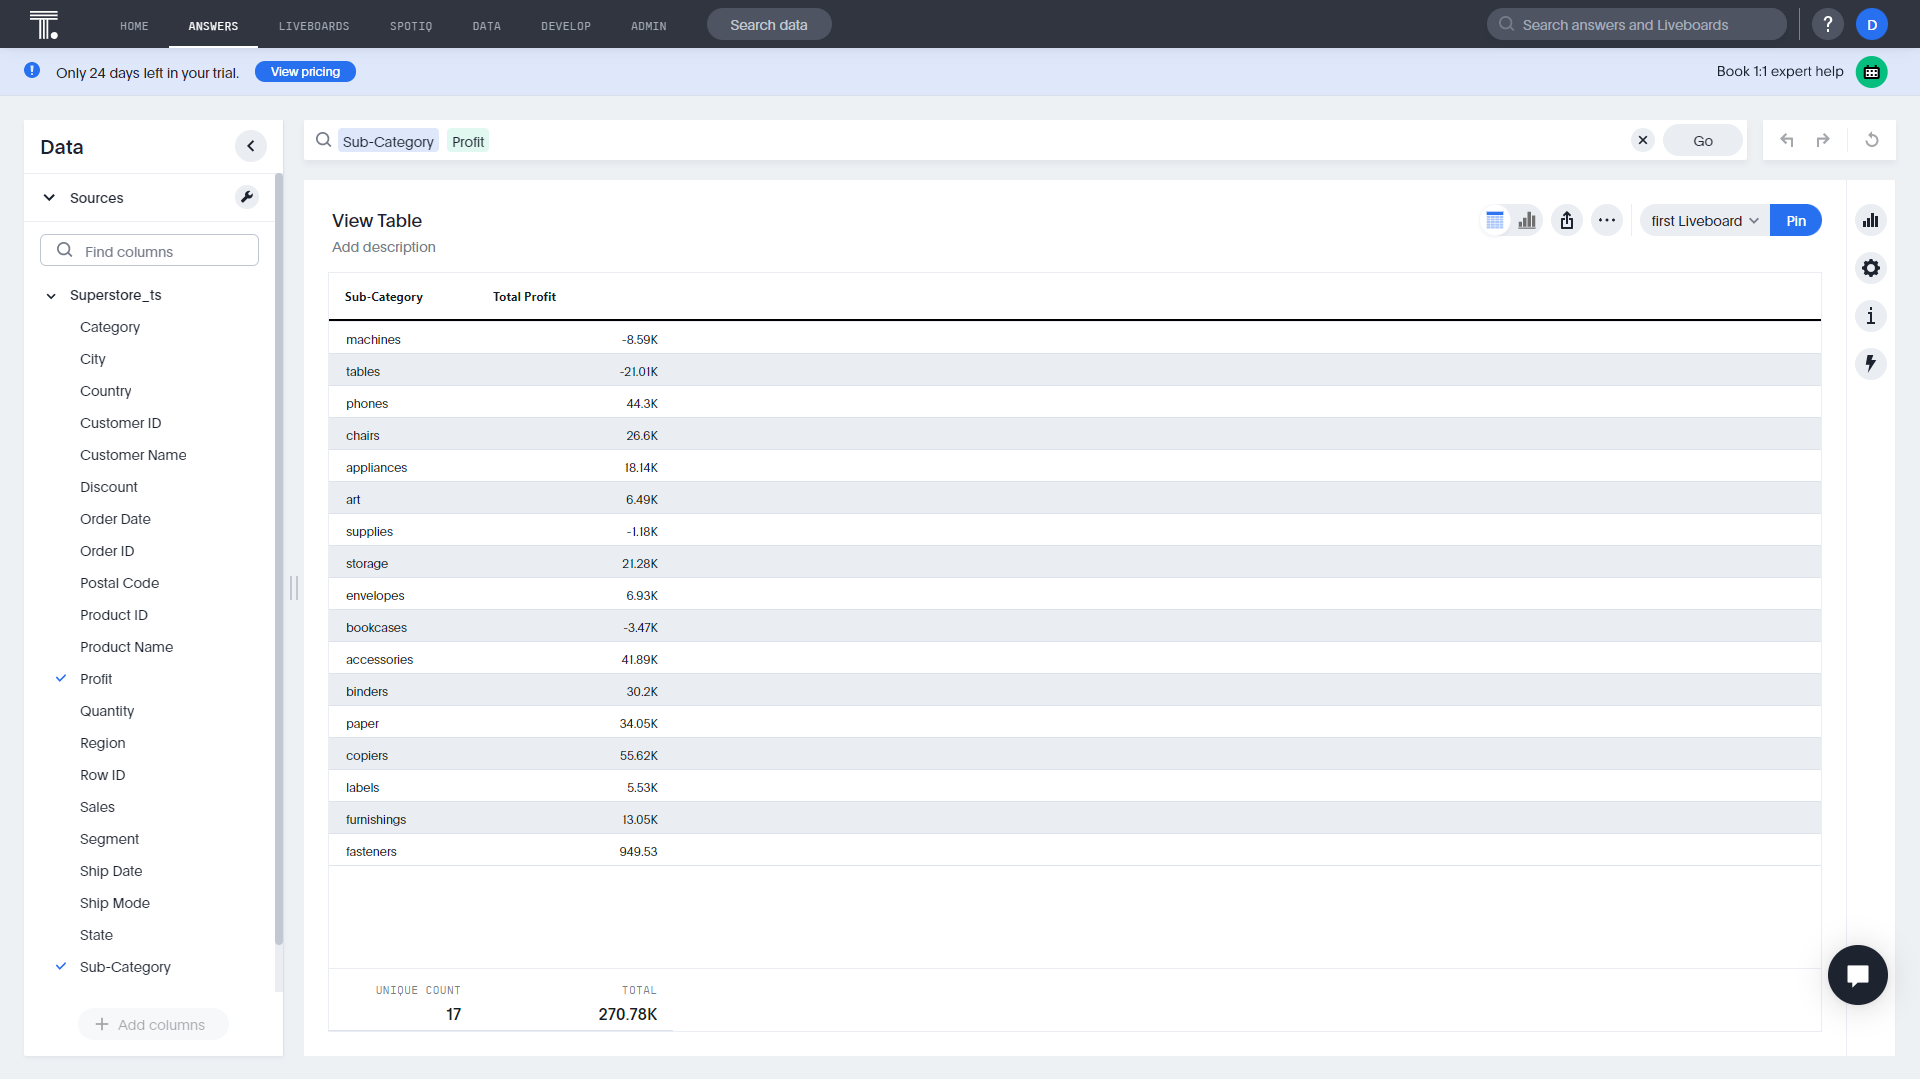
Figure 2-21 View table - ThoughtSpot 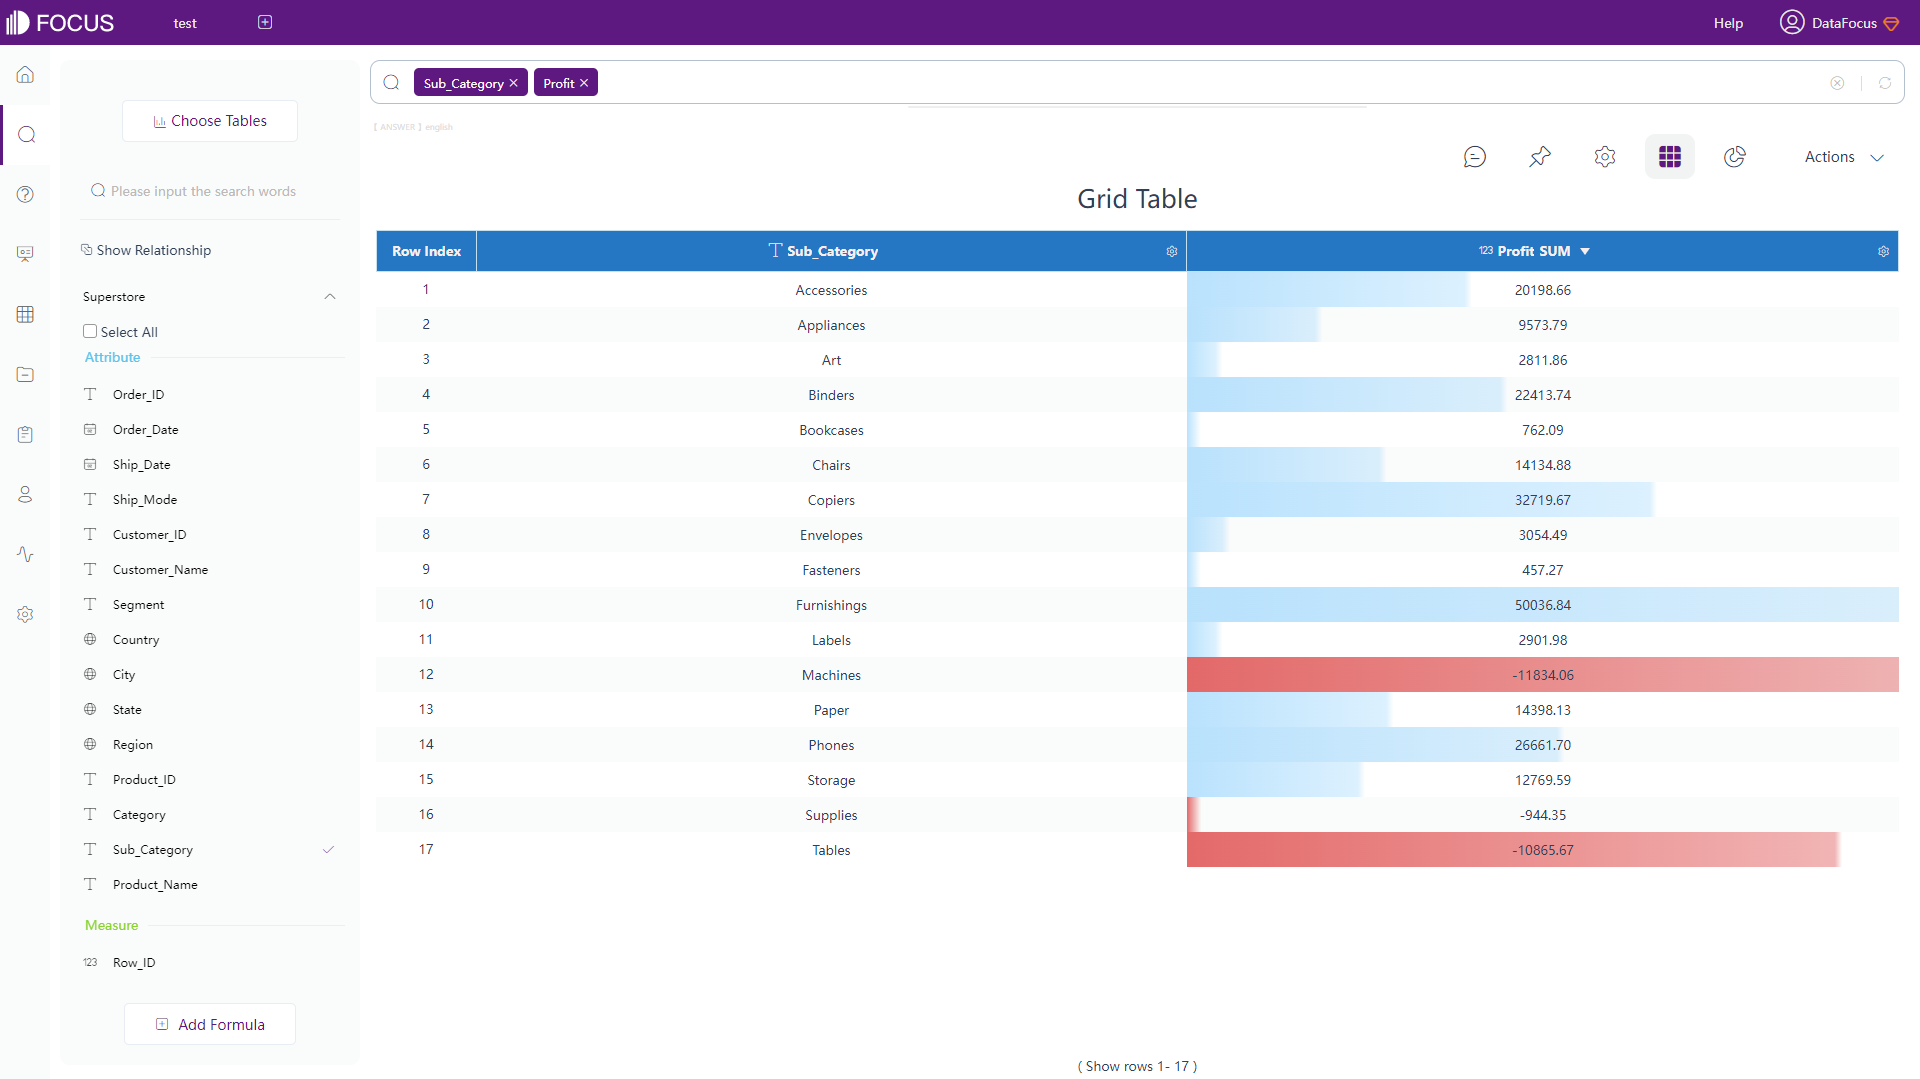
Figure 2-22 Grid table - DFC -
Pivot Table
Pivot table uses a tree structure to display data.
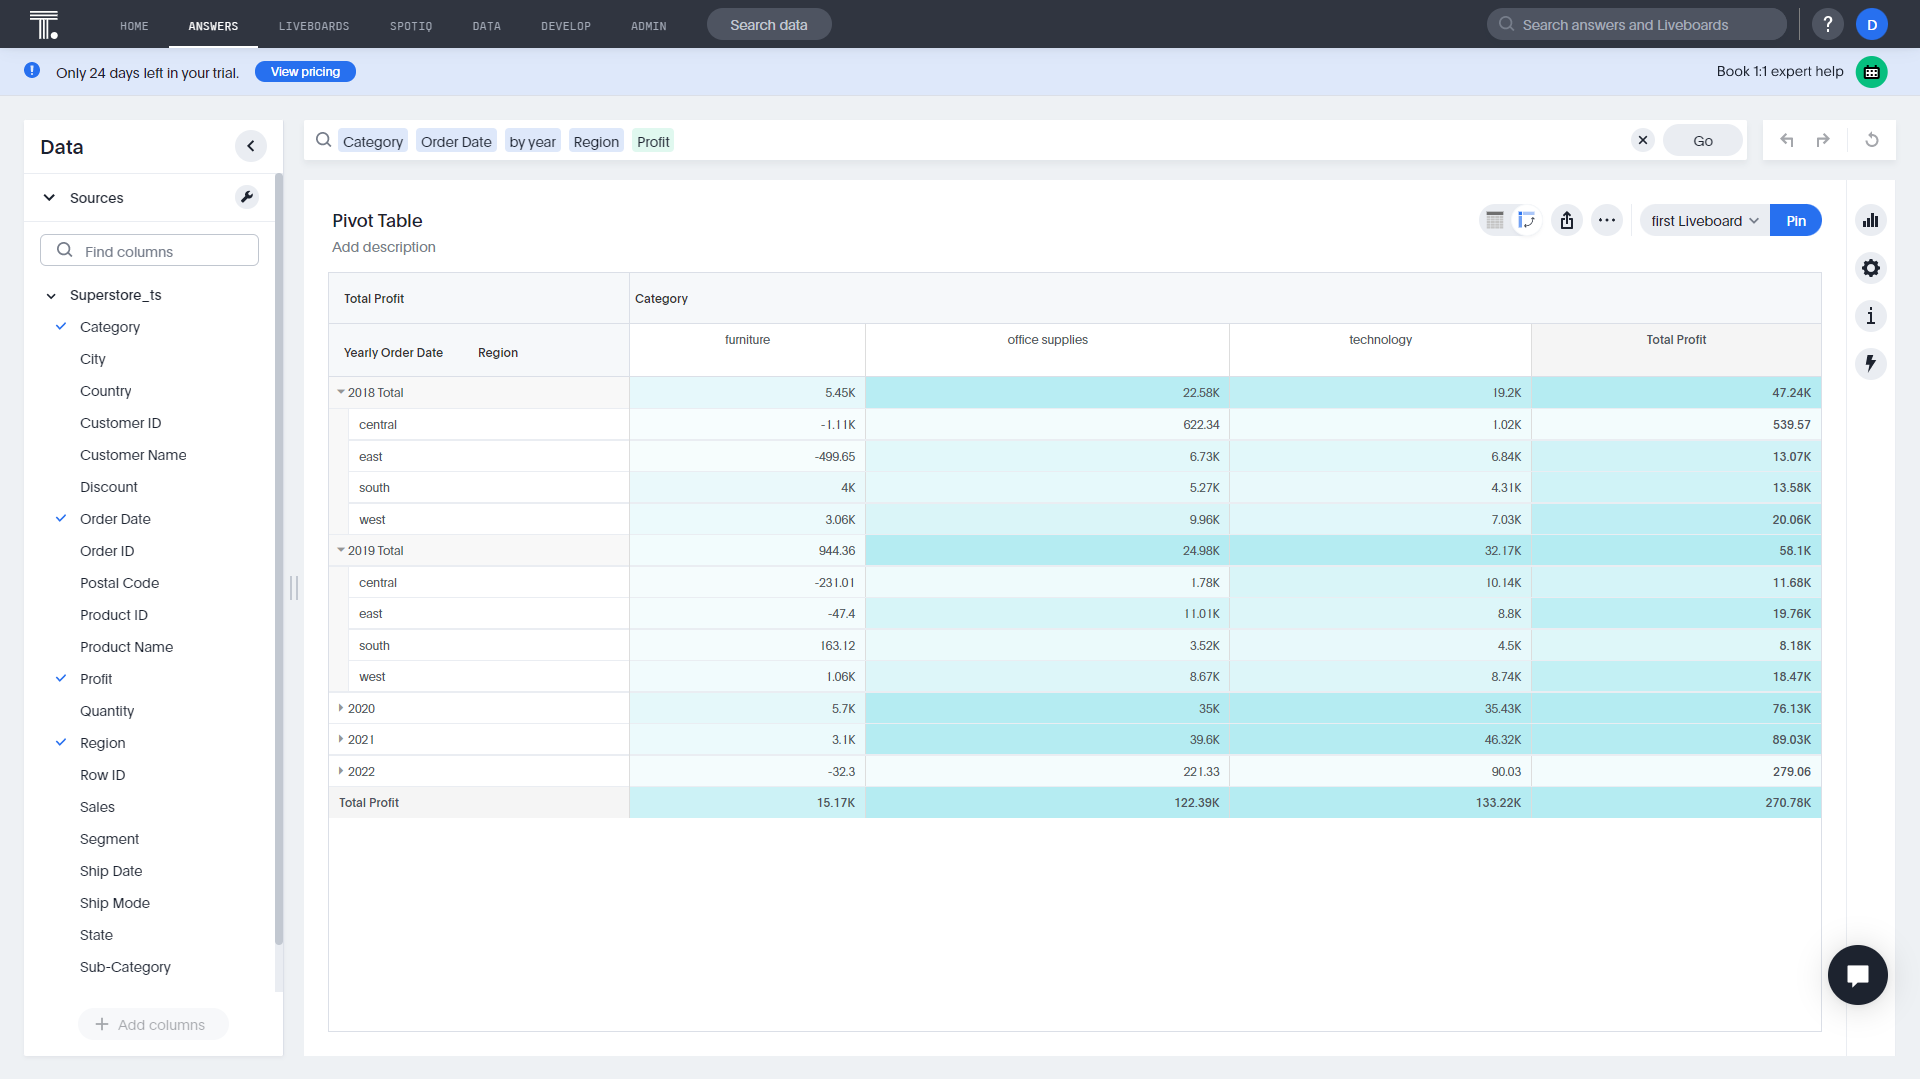
Figure 2-23 Pivot table - ThoughtSpot 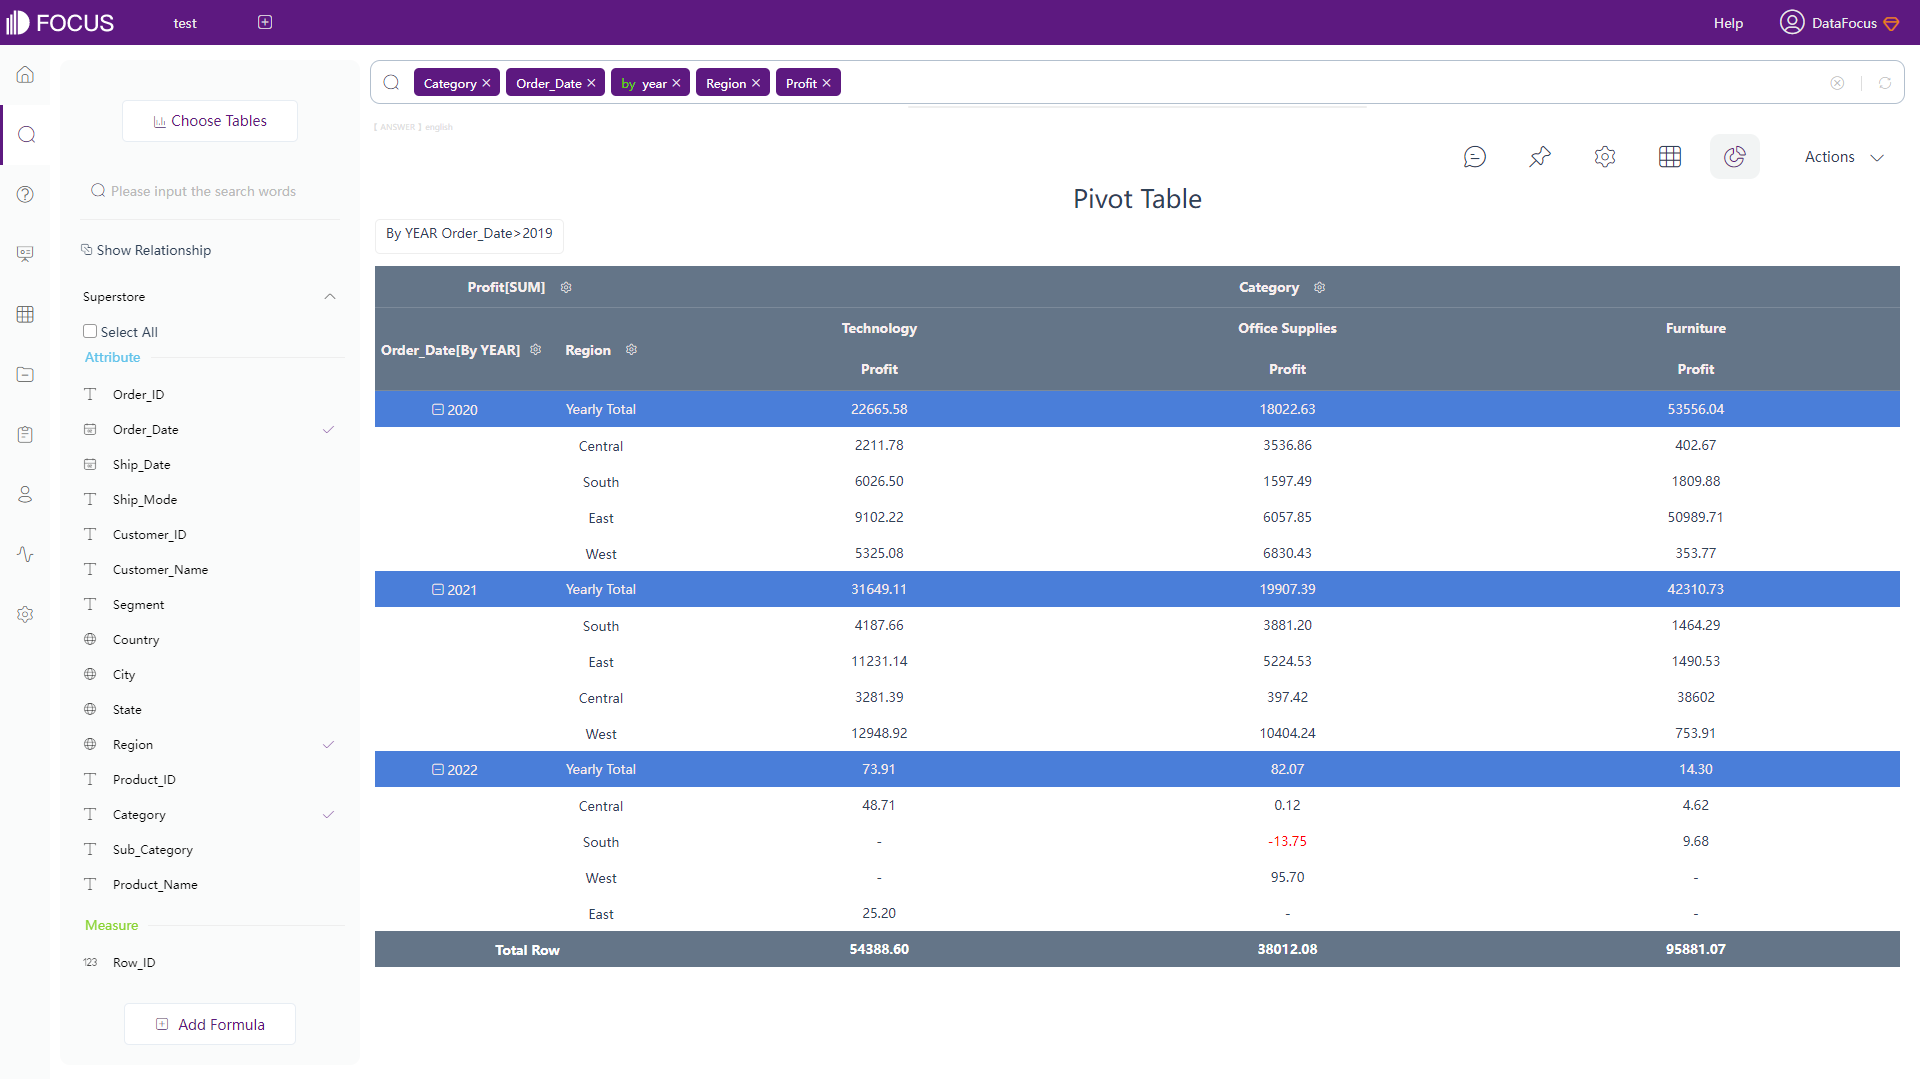
Figure 2-24 Pivot table - DFC Another table type supported by DFC is cross table, which displays data in multi-dimension. Cross table can satisfy various complicated business needs, as shown in figure 2-25.
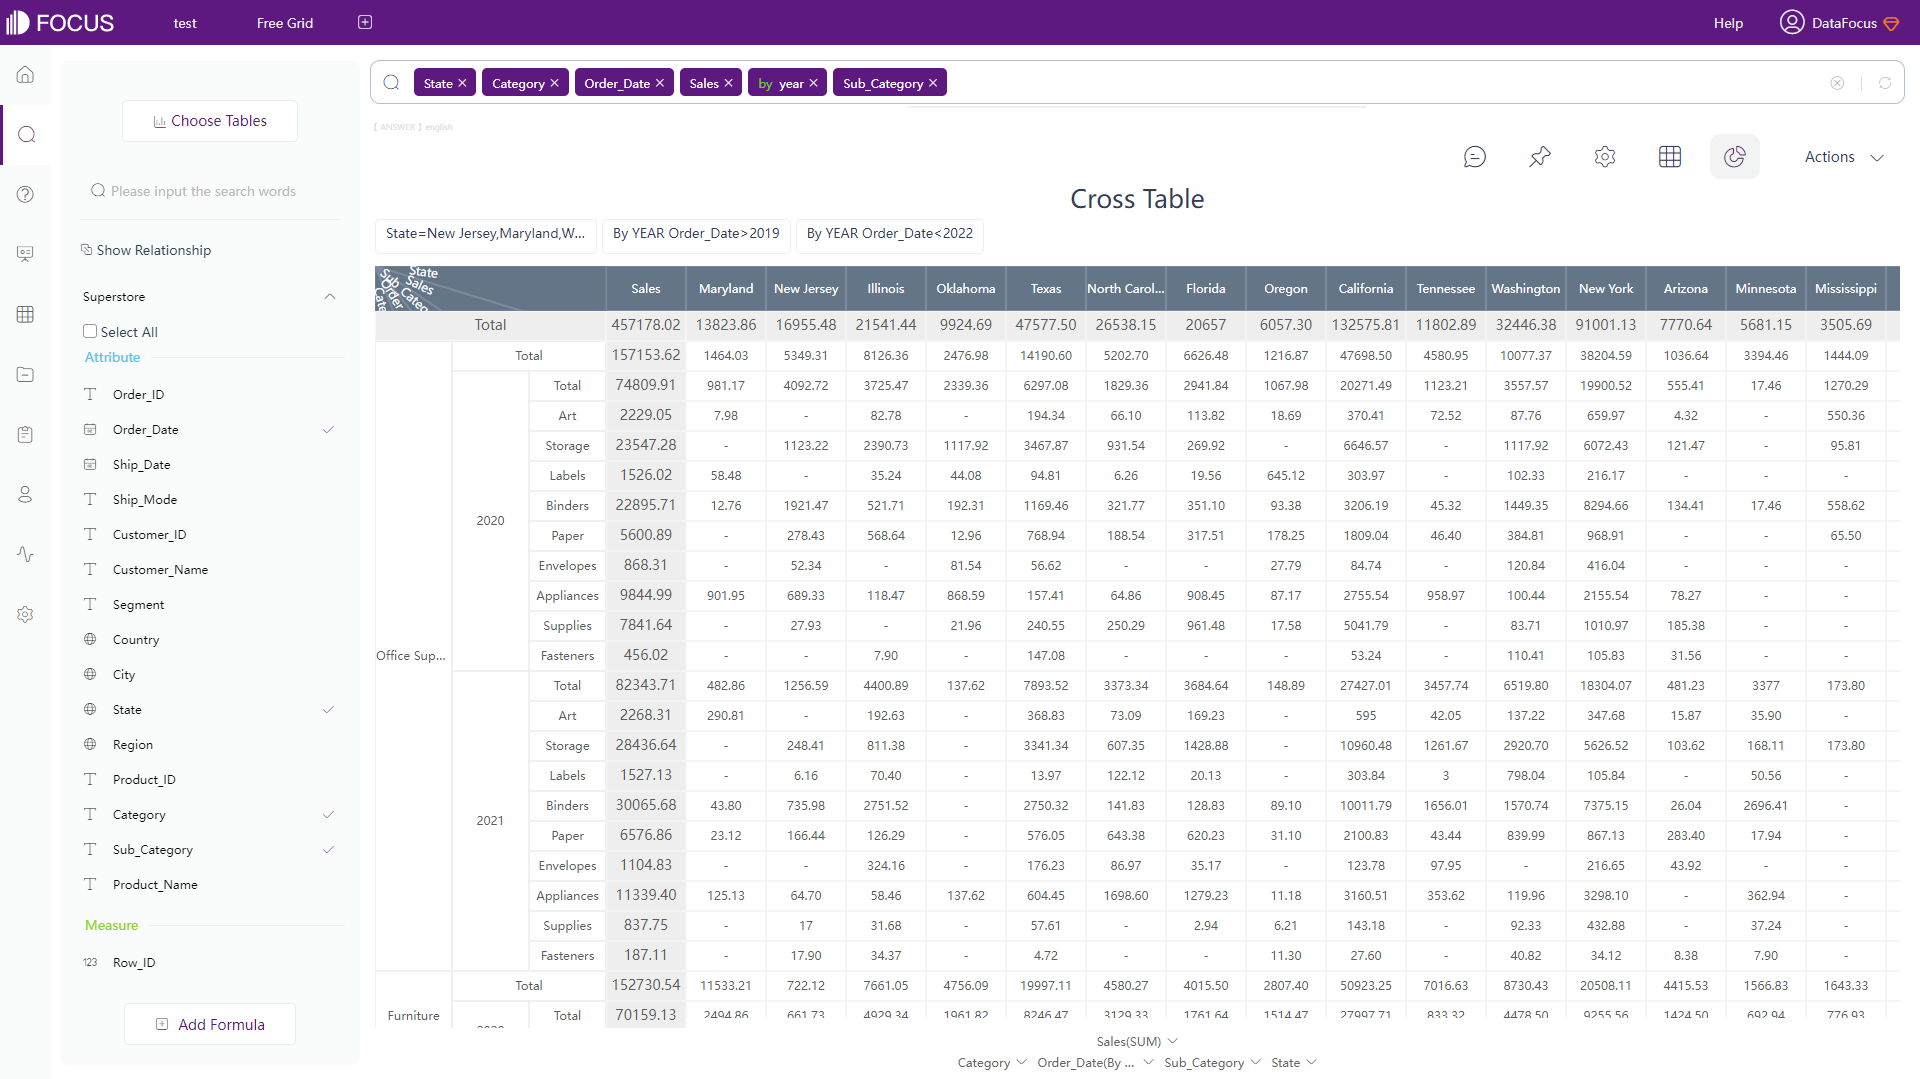
Figure 2-25 Cross table
-
-
Configuration:
-
View Table / Grid Table
The format of numbers, summary statistics, and some table format configurations are supported by both ThoughtSpot and DFC. However, DFC provides more kinds of configuration, including colors, alignment, index, heat map mode, etc. Detailed grid table configuration can be viewed here: table attributes.
-
Pivot Table
Other than the functions mentioned above, ThoughtSpot also supports heatmap mode, pivoting summaries, and compacting row headers for pivot table.
Similar to grid table, heat map mode, color, and font can be configured for pivot table in DFC. What’s more, a subtotal row can be added here to demonstrate more details, as shown in figure 2-24, rows in blue are the subtotal rows. The entire configuration of pivot table can be viewed here: pivot table.
-
Cross Table
Similarly, users can set the font, color, alignment of the table, and can add as well as pin headers, total columns and rows, as shown in gif figure 2-26.
GIF Figure 2-26 Cross table
-
2.5.2 Chart
ThoughtSpot supports 25 types of charts, and the customization is quite limited. Users can only choose to display labels or some auxiliary lines.
There are more than 50 types of charts supported by DFC. With a high degree of customization, users can change the color, format, suspend text, and other chart configurations according to different chart types.
Four parts to describe the specific charts:
-
Common Graphics
In terms of one of the most common charts – pie chart, ThoughtSpot only supports one form, as shown in figure 2-27.
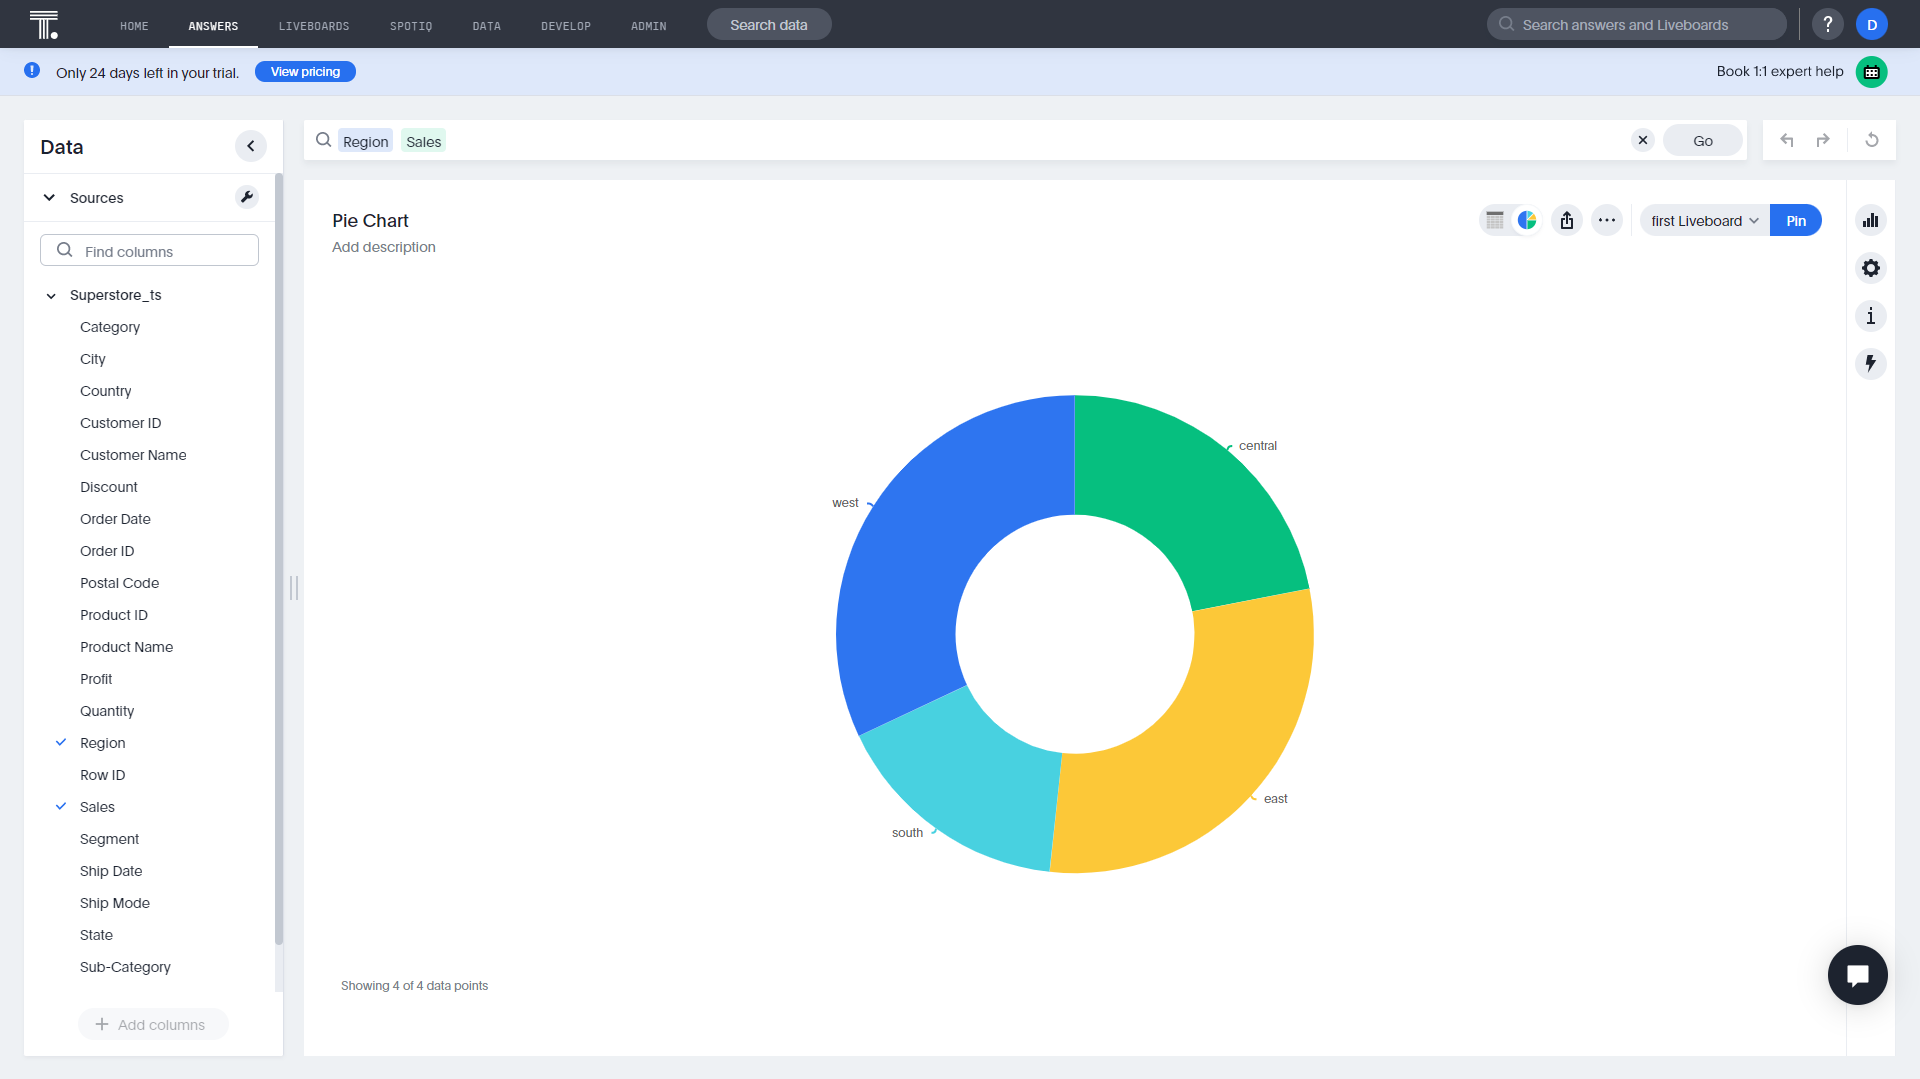
Figure 2-27 Pie chart - ThoughtSpot DFC provides many forms, such as pie chart, rose chart, ring chart, and sunburst chart.
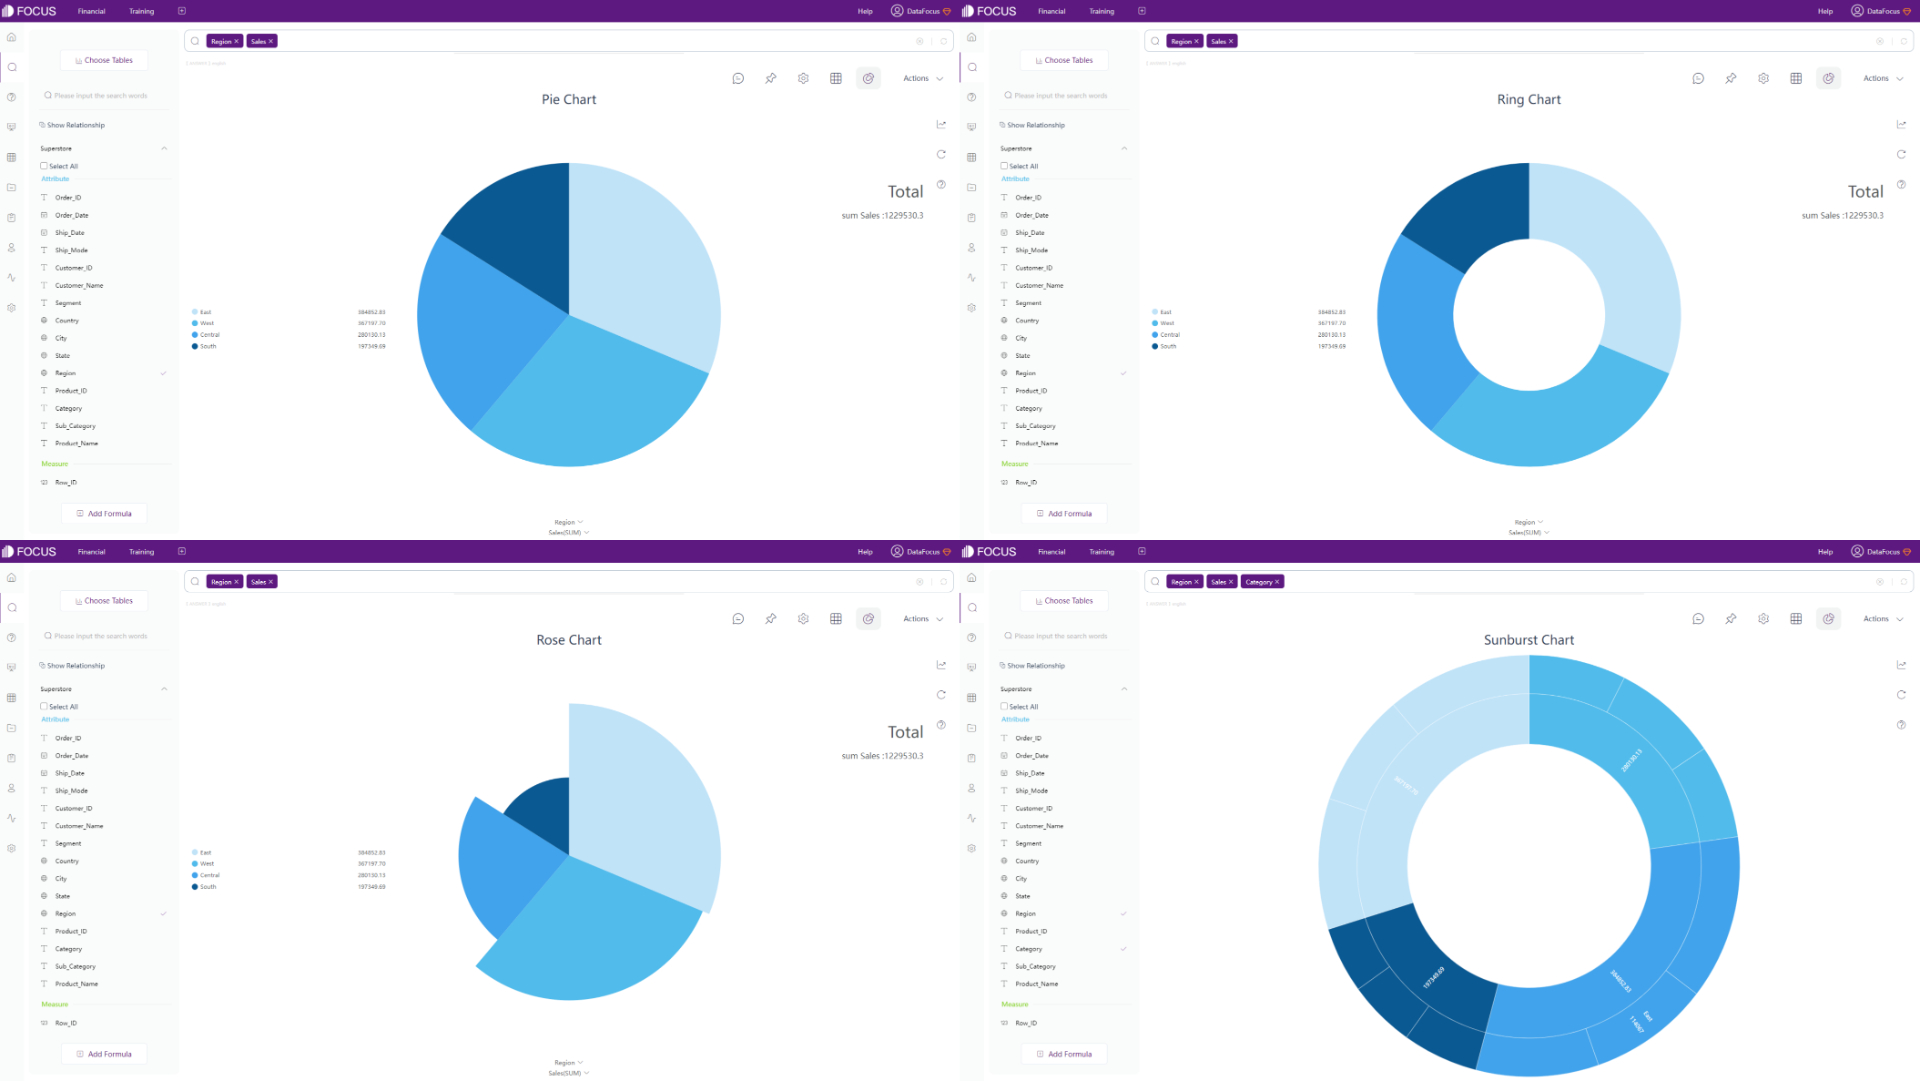
Figure 2-28 Pie charts - DFC -
Maps
ThoughtSpot provides Geo bubble chart, Geo heatmap chart, and Geo area chart.
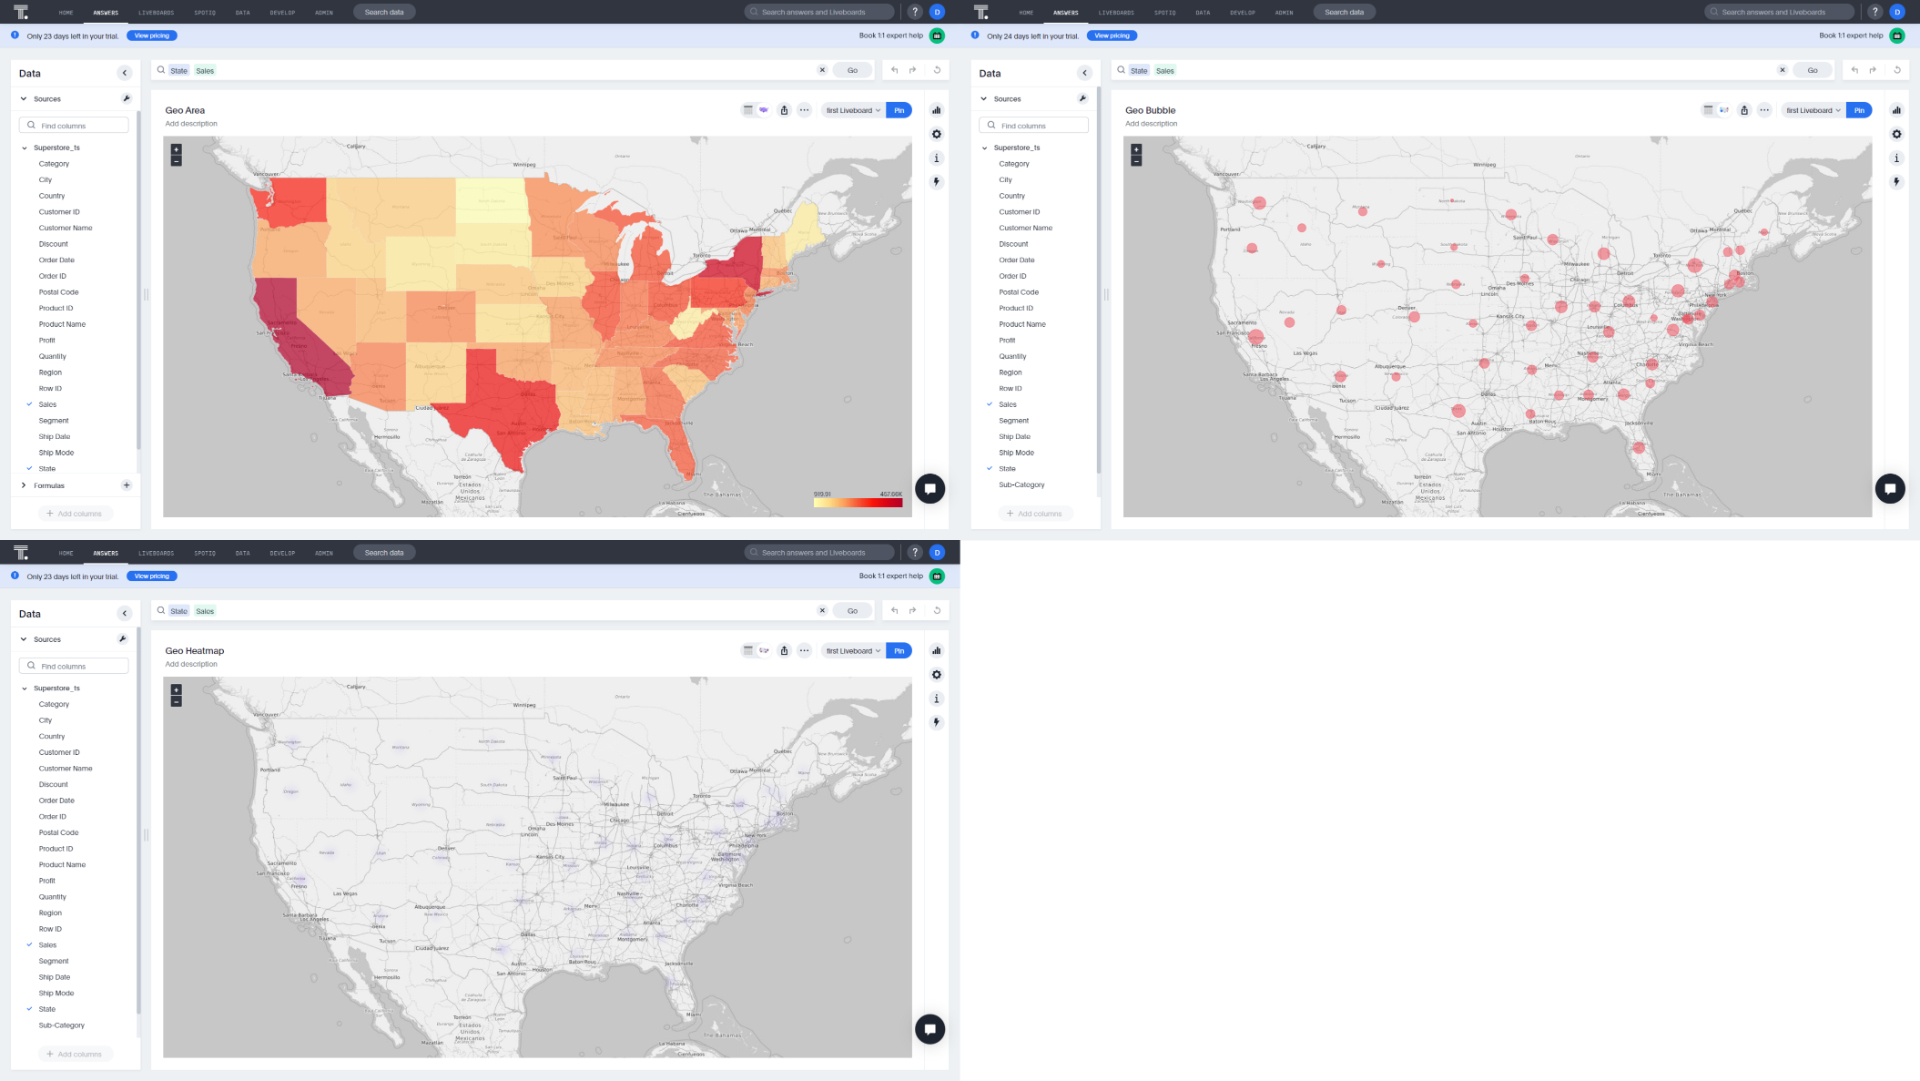
Figure 2-29 Maps - ThoughtSpot DFC supports several different kinds of maps, such as trajectory map, GIS location map, longitude & latitude location map, 3D globe scatter plot, etc. Also, users can upload their own maps or geographical data.
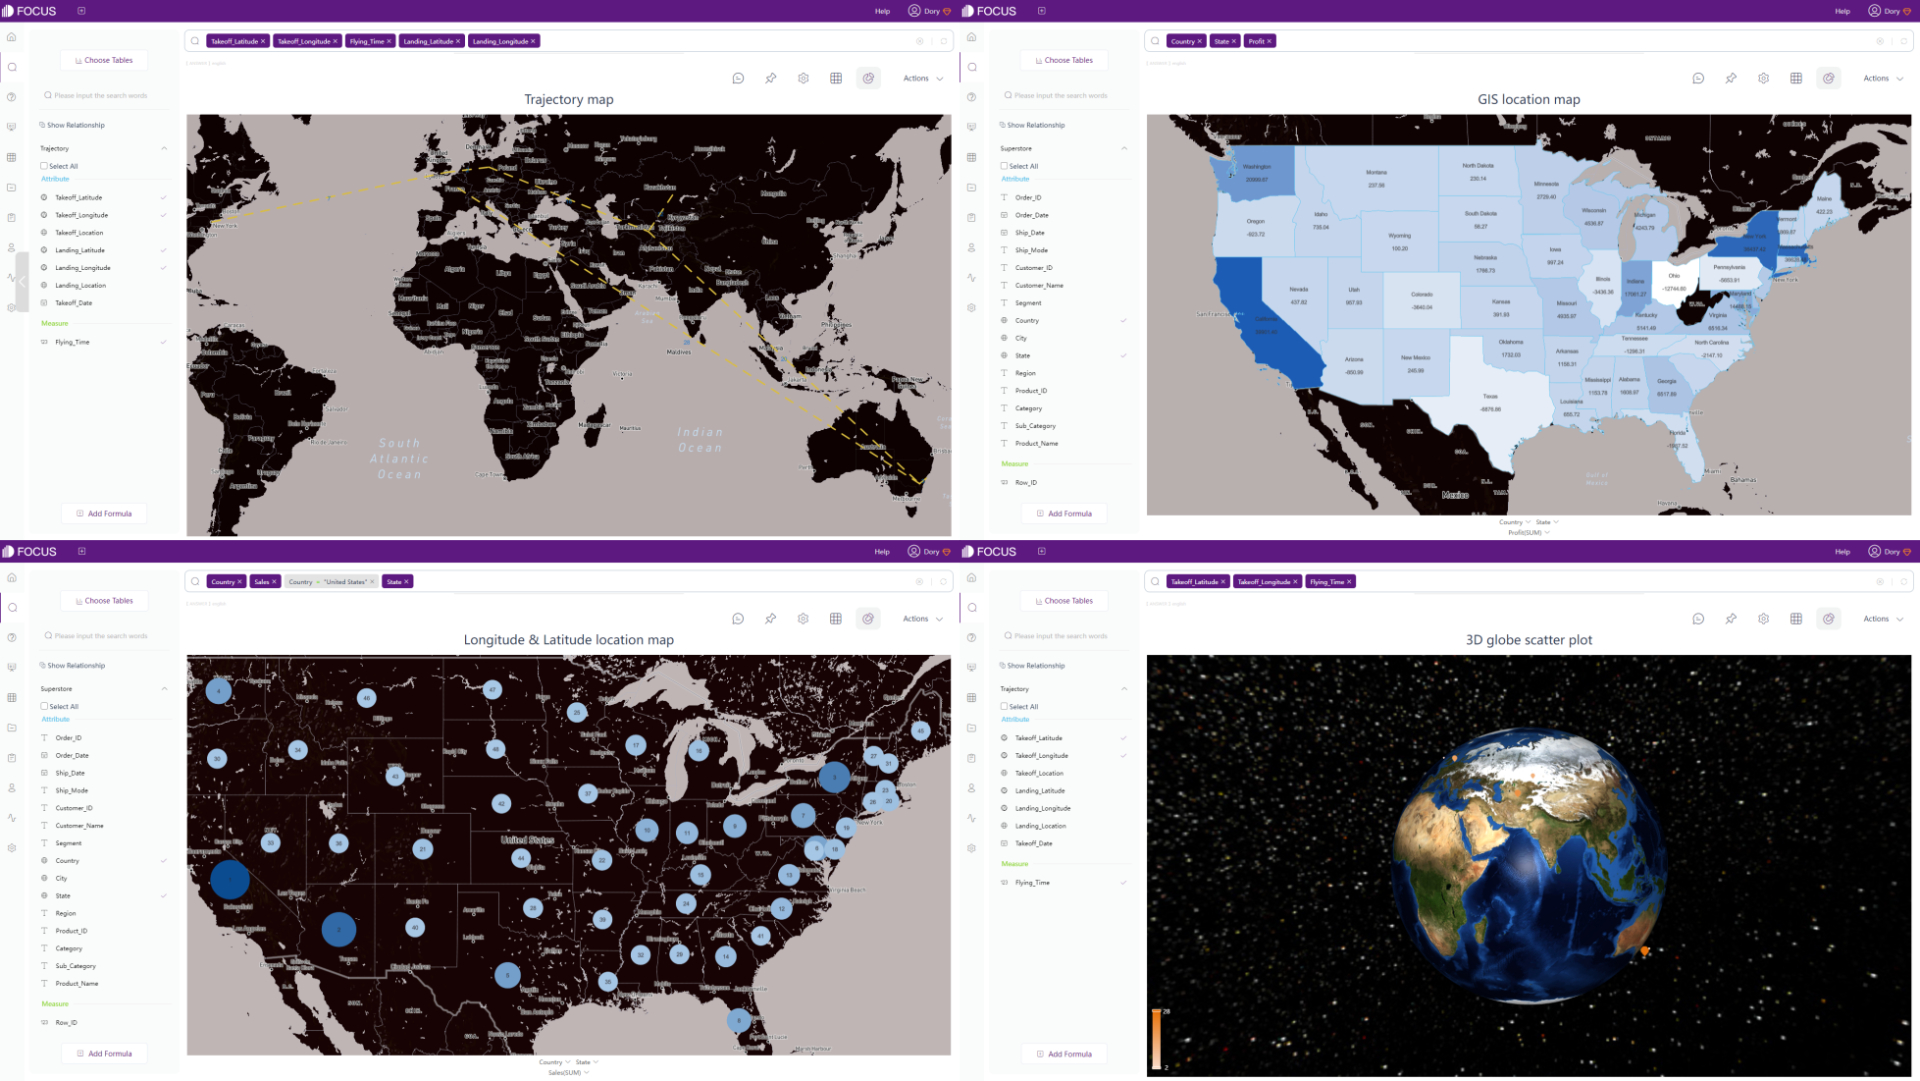
Figure 2-30 Maps - DFC -
Advanced Graphics
ThoughtSpot provides candlestick chart to display price movements over time, as shown in figure 2-31.
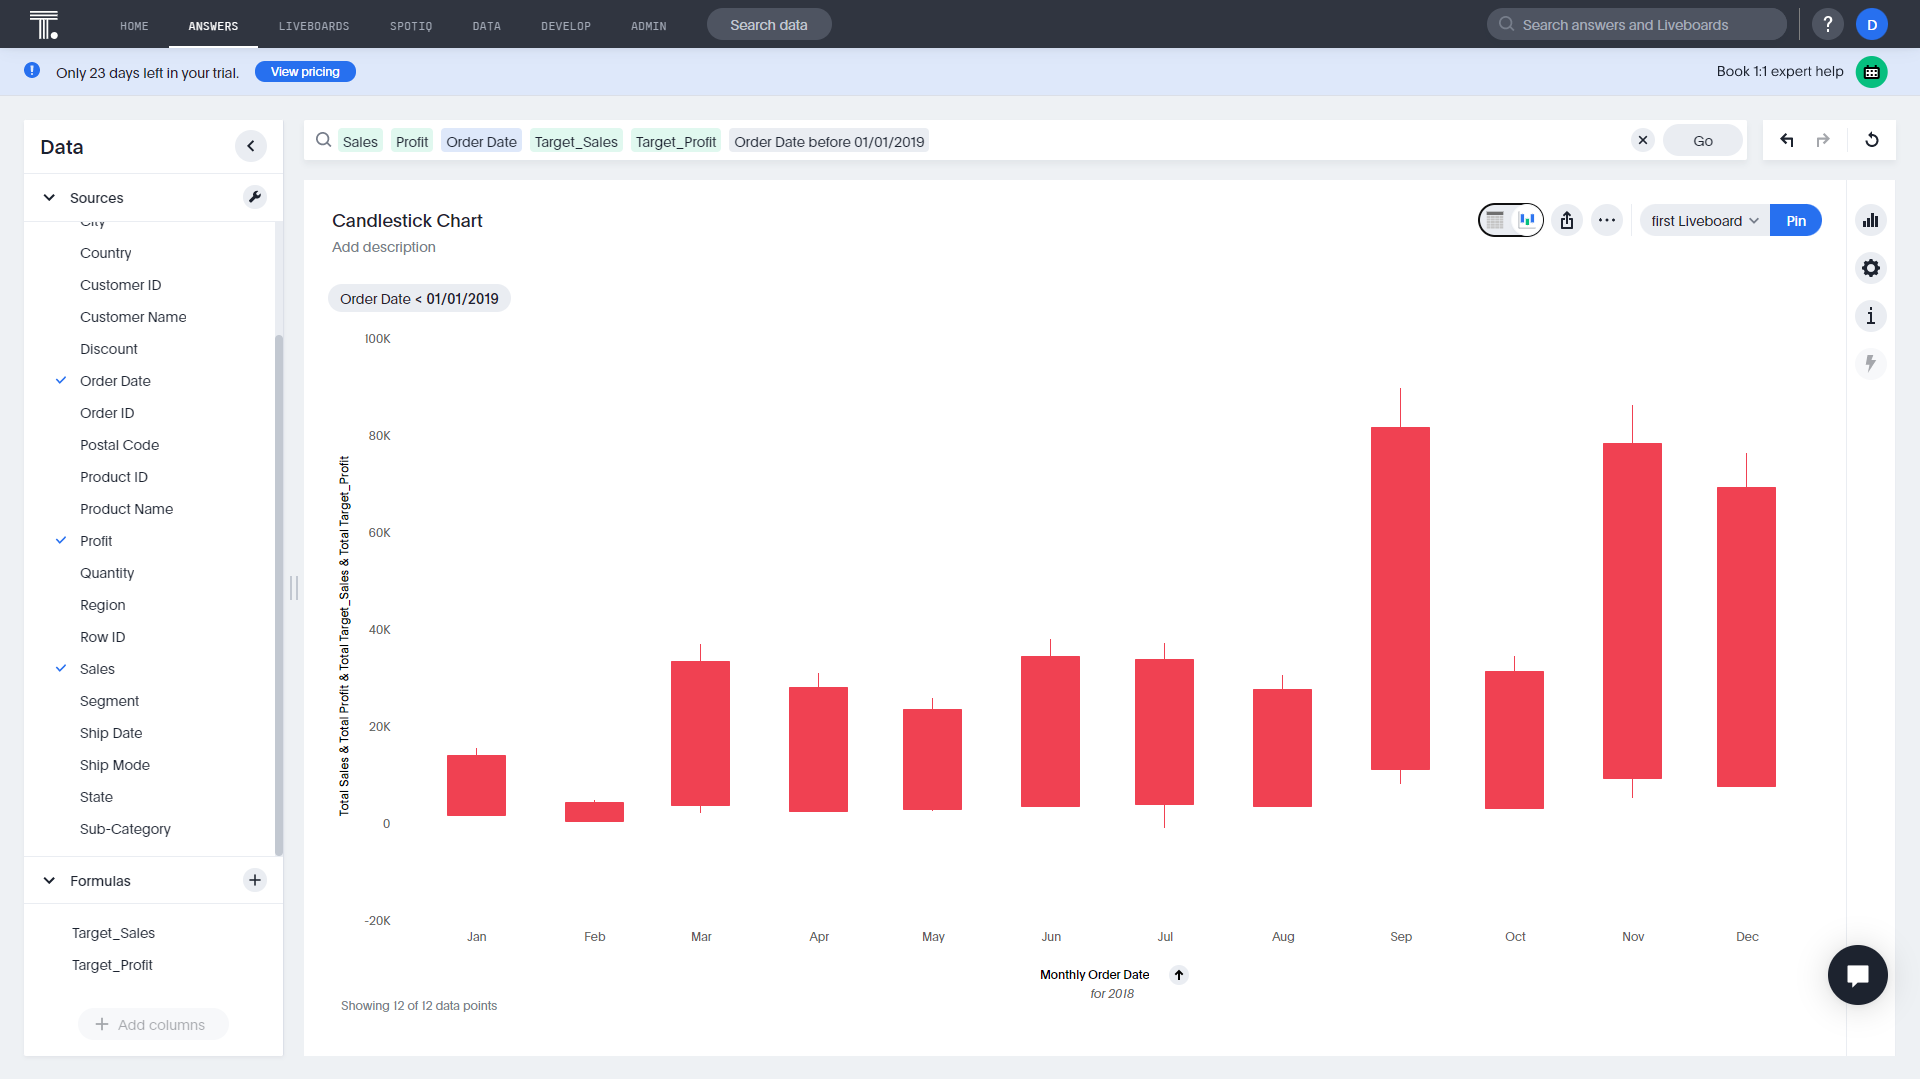
Figure 2-31 Candlestick chart - ThoughtSpot DFC supports some more advanced graphics to display different kinds of data, such as chord diagram, network diagram, bullet chart, boxplot, etc.
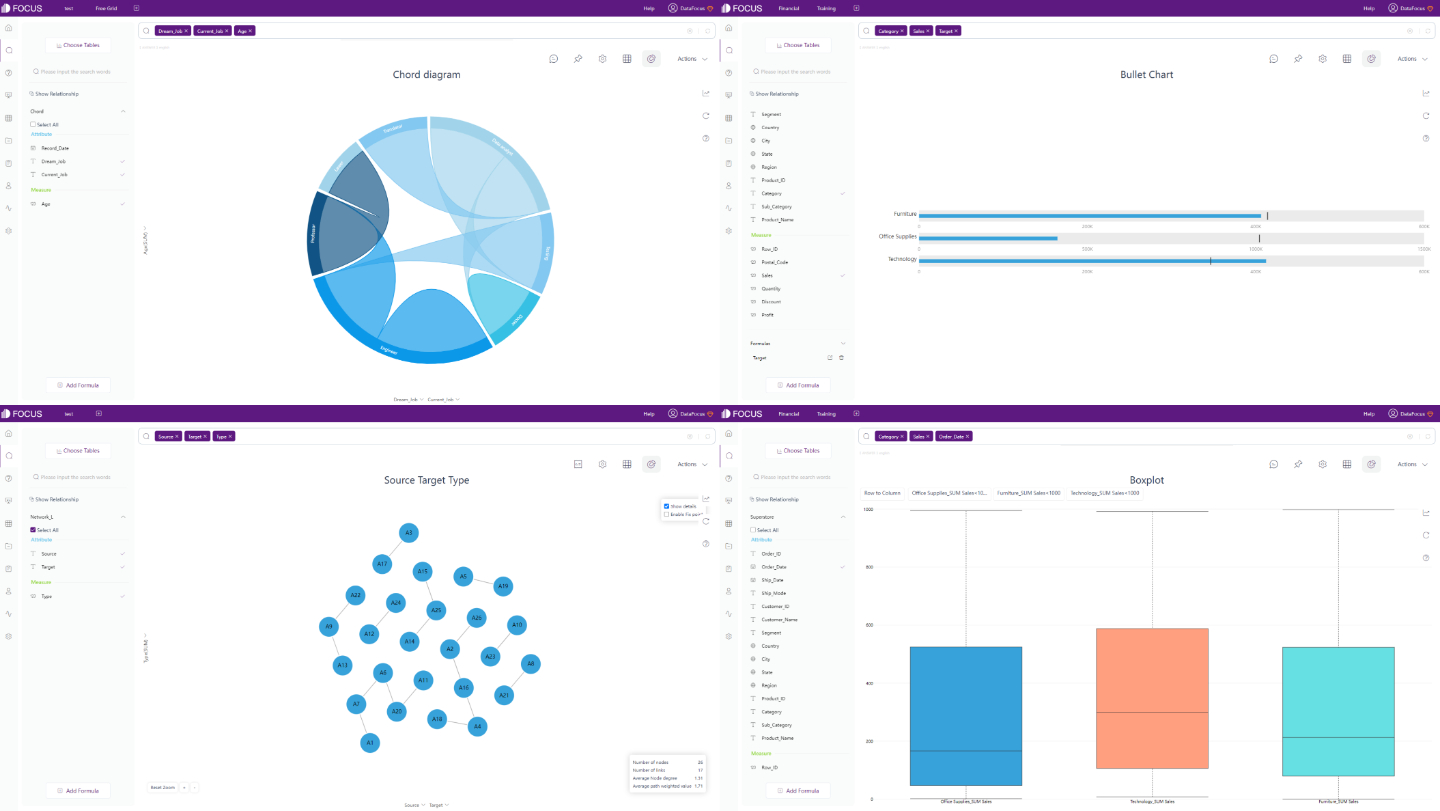
Figure 2-32 Advanced graphics - DFC -
Dynamic Graphics
DFC also has dynamic charts to show data changes in time or add animation to make the visualization more vivid, such as time series bubble chart, 3D globe fly line, etc.
GIF Figure 2-33 Time series bubble chart 
GIF Figure 2-34 3D globe fly line
2.5.3 Liveboard/Dashboard
Towards dashboards, ThoughtSpot brought up the concept of “Dashboards are dead”. Believing in modern cloud analytics, thinking it can deliver personalized insights for all, ThoughtSpot has a relevantly low degree of customization about liveboards.
DFC holds a different opinion: Dashboard is still an insightful tool for users to track data or make decisions, especially with real-time analytics and interactions. As long as the experience of creating a dashboard is better, such as easier to configure or with more abundant components. Therefore, the dashboard of DFC can be customized to a high degree. The differences are introduced in three parts:
| Aspect | ThoughtSpot | DataFocus Cloud |
|---|---|---|
| Add answers | Answer page | Dashboard editing page |
| Chart size | 5 preset sizes | Customized |
| Layout | Fixed grids | 2 layouts: free, grid |
-
Add Answers
In ThoughtSpot, users need to add answers to liveboards on the viewing page of answers.
While in DFC, users can add or replace the answer on the dashboard editing page.
-
Chart Size
Sizes of charts on ThoughtSpot can be changed to 5 different preset ones, and chart sizes on DFC can be customized by typing the height and width. Also, charts can be dragged to change size freely.
GIF Figure 2-35 Change chart size -
Layout
Charts in ThoughtSpot can be moved freely among the grids, and other charts will adjust their positions accordingly.
The grid layout in DFC is similar to the layout in ThoughtSpot. While under the free layout, charts can be moved arbitrarily, as shown in gif figure 2-36.
GIF Figure 2-36 Different layouts Except for the aspects explained above, DFC also supports many other different dashboard customizations. For example, users can add text, image, video, and media objects, and view the entire custom objects here: custom components. Also, a series of templates are provided to help users to create dashboards quicker, as shown in figure 2-37.
Figure 2-37 Dashboard templates
2.5.4 Speed
DataFocus Cloud is faster than ThoughtSpot, in terms of responding to searches, changing chart types, etc.
2.6 Resource Management
As explained above in section 2.1.4, ThoughtSpot and DFC use tags to help manage resources. Also, there are two display modes on DFC to satisfy different viewing needs. To switch between answers or other resources, there are small navigation bars on both ThoughtSpot and DFC to quickly switch between different kinds of resources.
Furthermore, DFC has projects which are the same as folders in computers. Therefore, users can place all kinds of resources into projects to better classify them.
2.7 Collaboration
Under a free trial, users may not be able to utilize the functionality of privileges or groups in ThoughtSpot. However, roles and departments modules in DFC are open to all users, even under a free trial.
2.7.1 Privileges/Roles
To enable different users with different capabilities, ThoughtSpot uses privileges and DataFocus Cloud uses roles.
Privileges include “Can administer ThoughtSpot”, “Can download data”, etc are set and given by the administrator. Also, privileges are detailed actions that users can make, such as downloading, editing, sharing, etc.
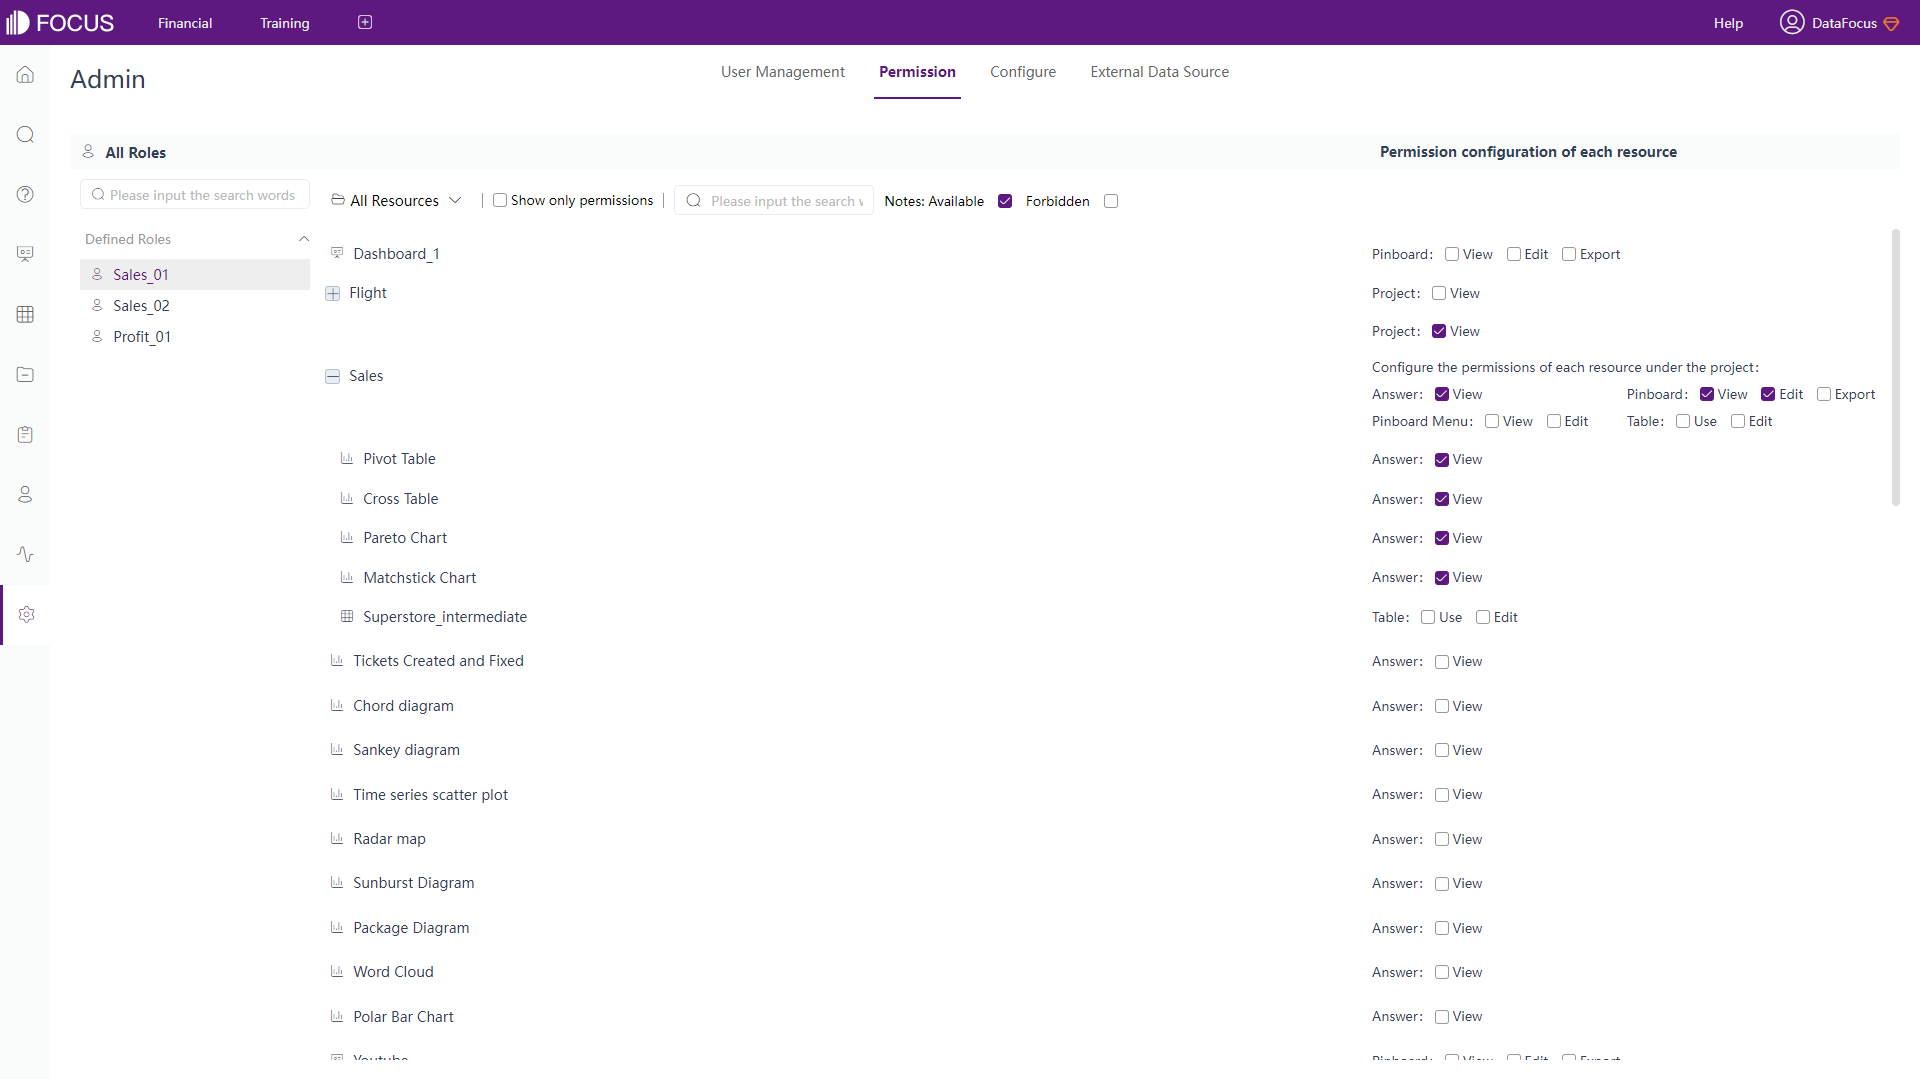
Roles, on the other hand, are classified according to different modules, such as resource, department, log, etc. However, those roles are preset system roles, users can also add custom roles to fulfill more needs. Detailed permissions like whether the member can edit the dashboard can be set for different custom roles, as shown in figure 2-42. View the entire list of roles: Roles.
2.7.2 Groups/Departments
Privileges are assigned to groups, and then users are added to groups. Therefore, groups can determine what members are allowed to do. Also, groups can belong to other groups.
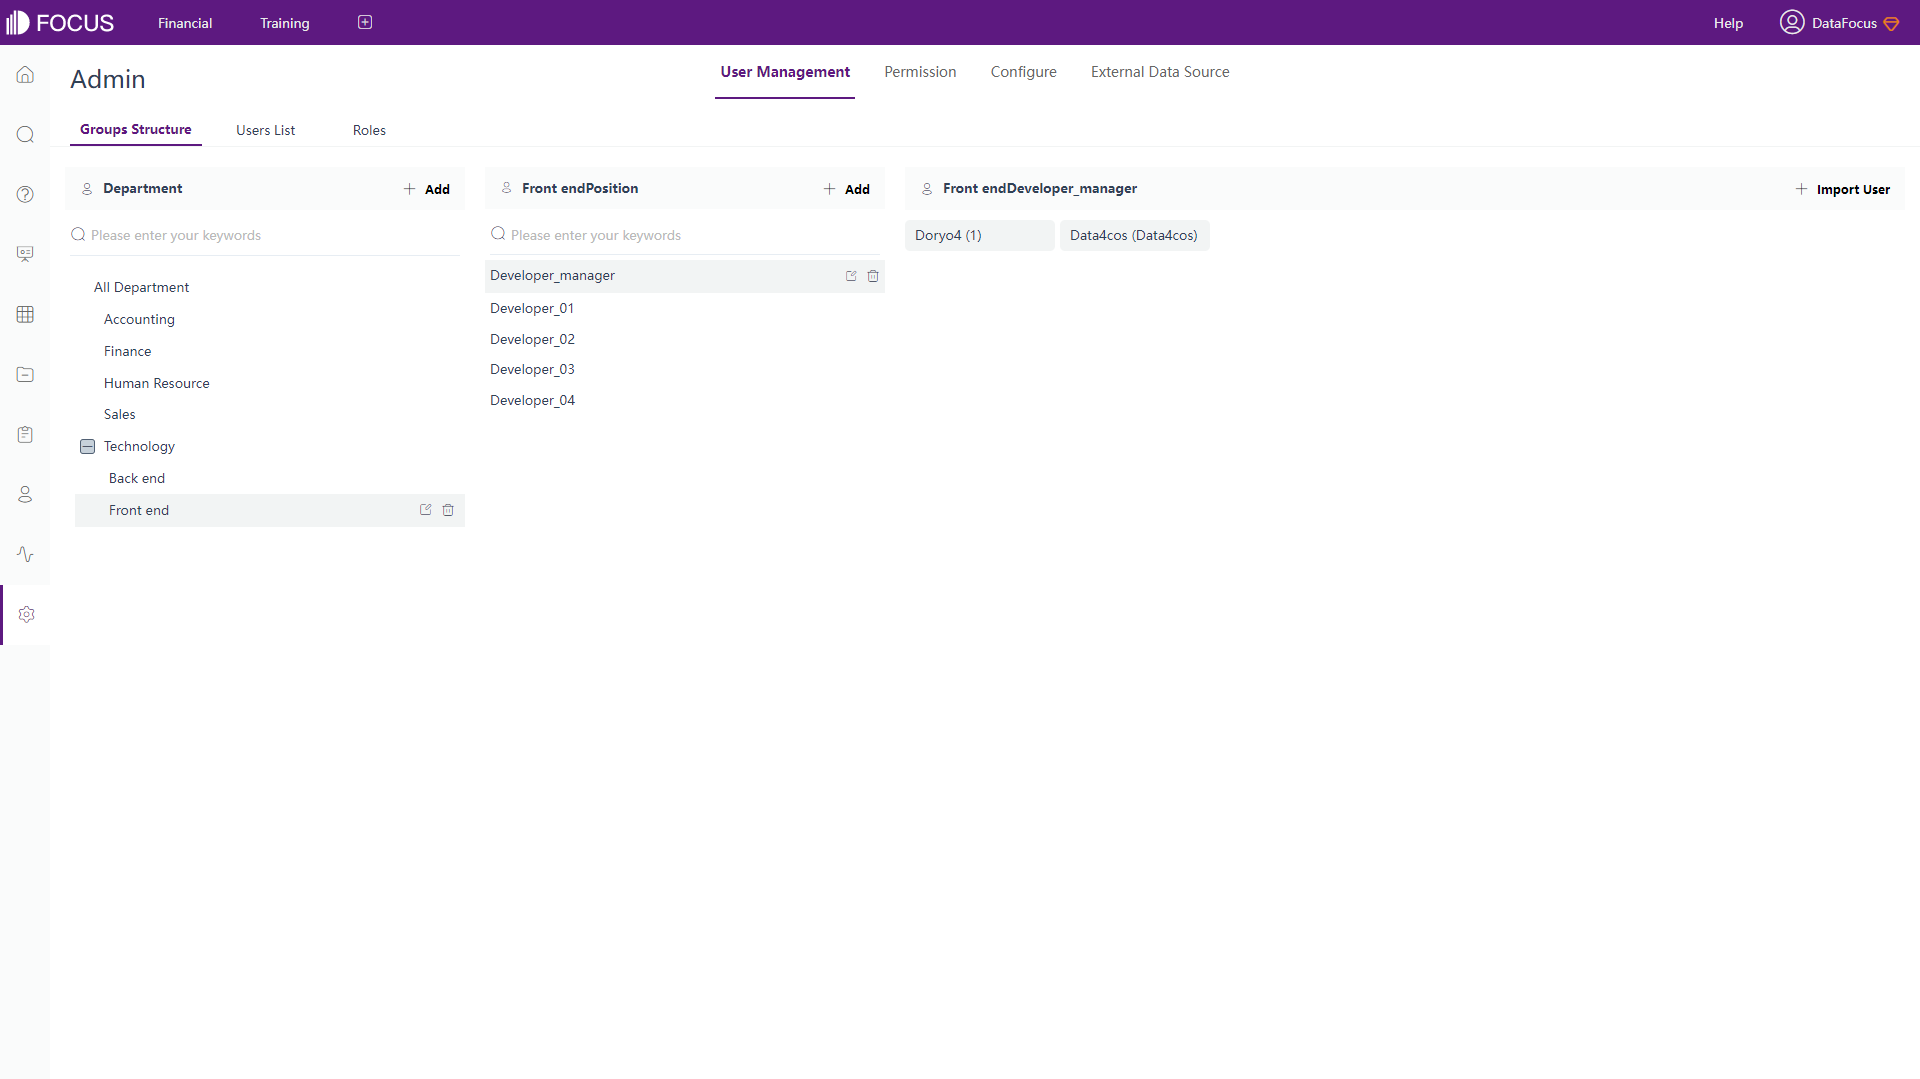
Departments in DFC are more like departments in reality, where each user can belong to one or multiple position(s) as well as department(s). Then, with different roles assigned, users can access different resources. For example, “Developer Bob” from “Front end” department under the “Technology” department can add as well as manage new resources. Check the whole department structure here: Department Structure.
2.7.3 Share
By clicking the share button in ThoughtSpot, resources can be shared with users or groups through email.
Share within DFC has two different ways. One is assigning access to members within the system, another is through an external viewing address, where external users can view and interact with resources by a link or a QR code.
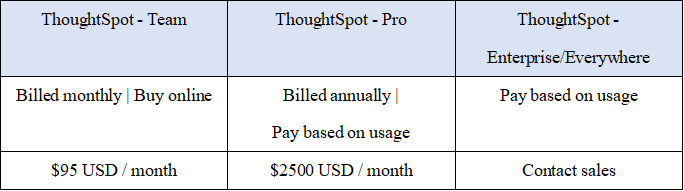
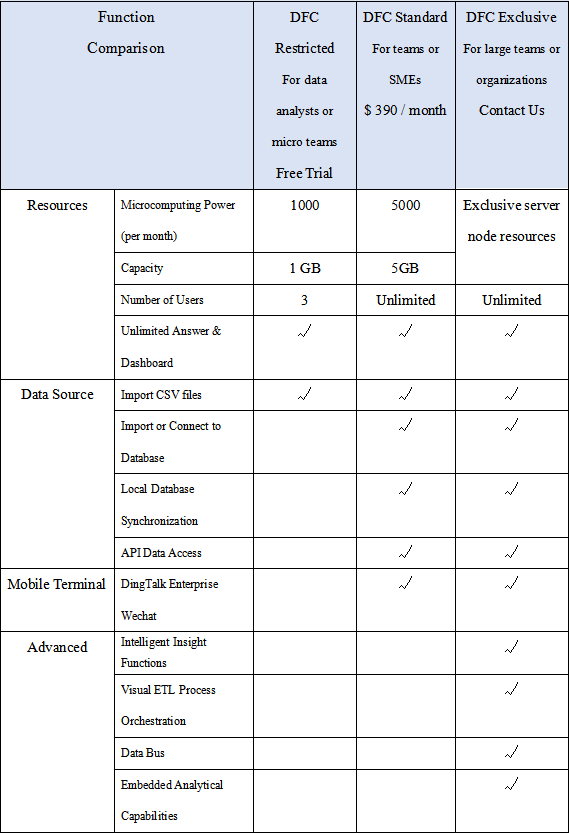
2.8 Cost
ThoughtSpot and DataFocus Cloud bills per usage/capacity. The table below shows the full pricing plans.
3. Conclusion
ThoughtSpot and DataFocus Cloud are two era-leading tools for search-based data analysis. The search may have many similarities in terms of keywords, but the interface, visualization, user management, etc are very different.
ThoughtSpot provides extensive keyword search and collaboration if under Team edition. However, the visualization is relevantly less plentiful, especially with regard to dashboard and its customization.
With abundant kinds of chart types, chart configurations, and dashboard configurations, DFC makes the visualization more beautiful and vivid. Also, the comprehensive system makes collaboration easier and more systematic. DataFocus Cloud would continue creating a better data analysis experience. Try out here: DFC.
