Amazon QuickSight vs DataFocus Cloud
In the world of business intelligence and data analysis, there are many tools to help deal with data. Two useful tools in this field are Amazon QuickSight and DataFocus Cloud (DFC). These tools provide various features and functionalities for data processing, data analysis, and data visualization.
With search-based analytics, DFC offers a comprehensive system for users to process, analyze, and visualize data, making it easy to turn raw data into actionable insights.
In this article, we’ll compare Amazon QuickSight and DataFocus Cloud with regard to the interface, ease of use, visualization, and other factors to help you make an informed decision about which tool is appropriate for you or your organization.
1. Introduction
With interactive dashboards, paginated reports, embedded analytics, and natural language queries, Amazon QuickSight provides an easy-to-use platform to analyze and visualize data. Businesses can gain insights into data quickly.
DataFocus Cloud allows businesses to quickly and easily create interactive dashboards, reports, and visualizations, without bothering technique expertise. With the scalable solution, businesses can gain a competitive edge through data-driven decision-making.
2. Comparison
2.1 Interface
The differences between the two platforms are explained in terms of the navigation bar, data, analyses, resource modules, and community.
2.1.1 Navigation Bar
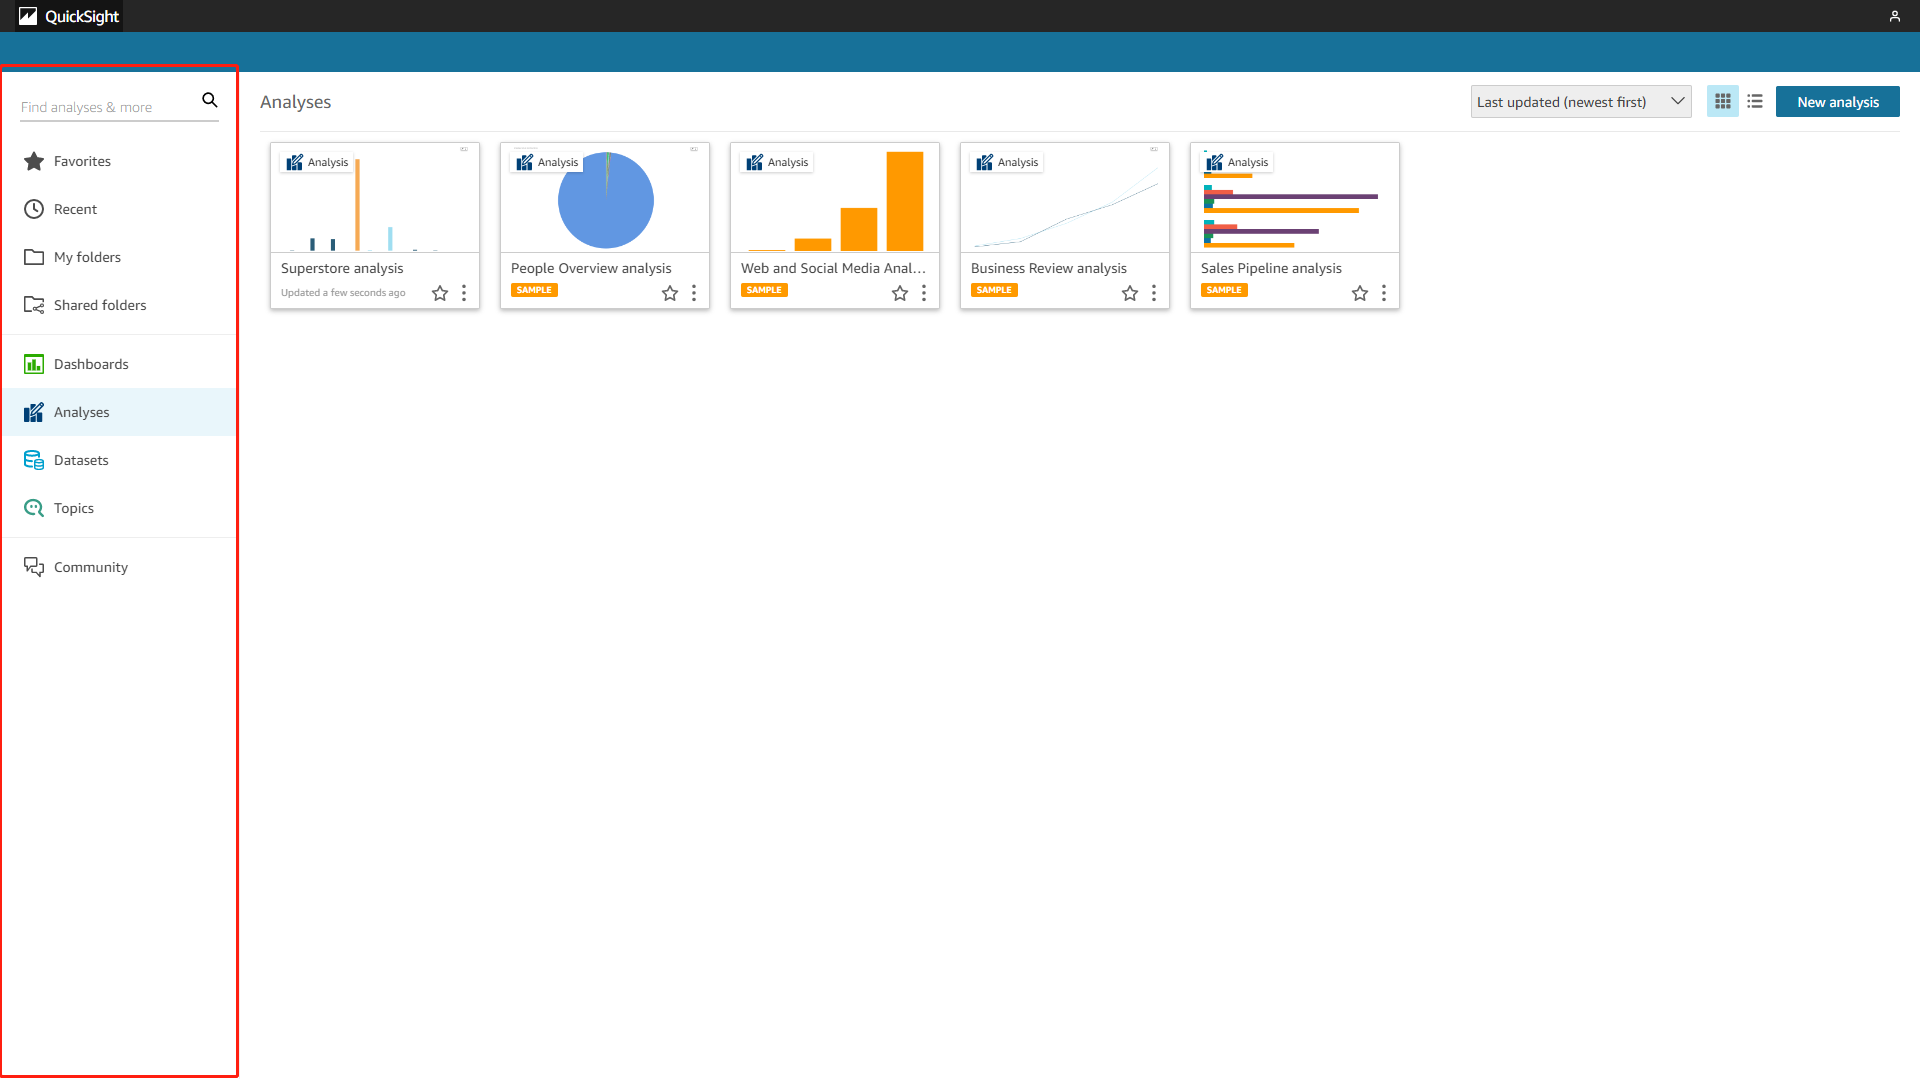
The navigation bar of Amazon QuickSight is mainly on the left. On the console, the navigation bar displays different modules such as different resources and community, as shown in figure 2-1. If you go to a specific analysis, then the navigation bar would show different features like “Filter”, “Parameter”, etc. for the analysis.
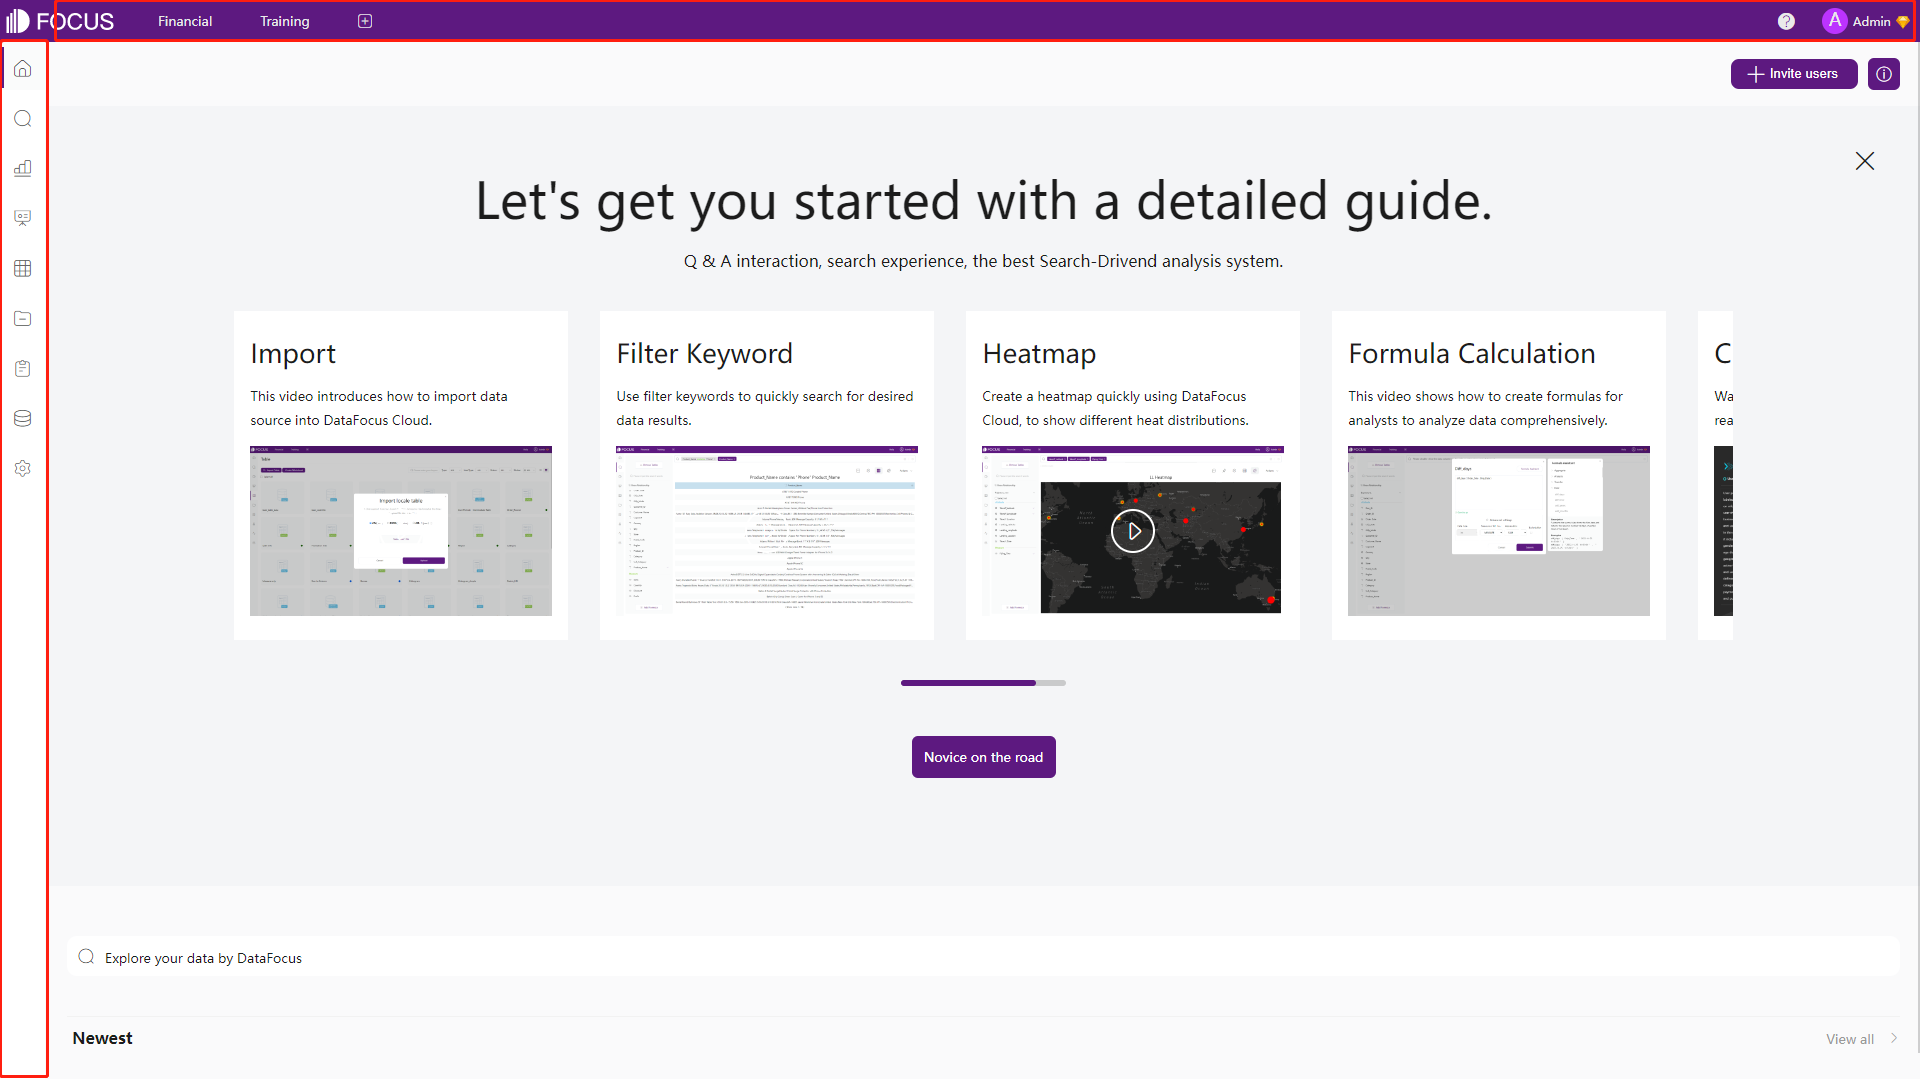
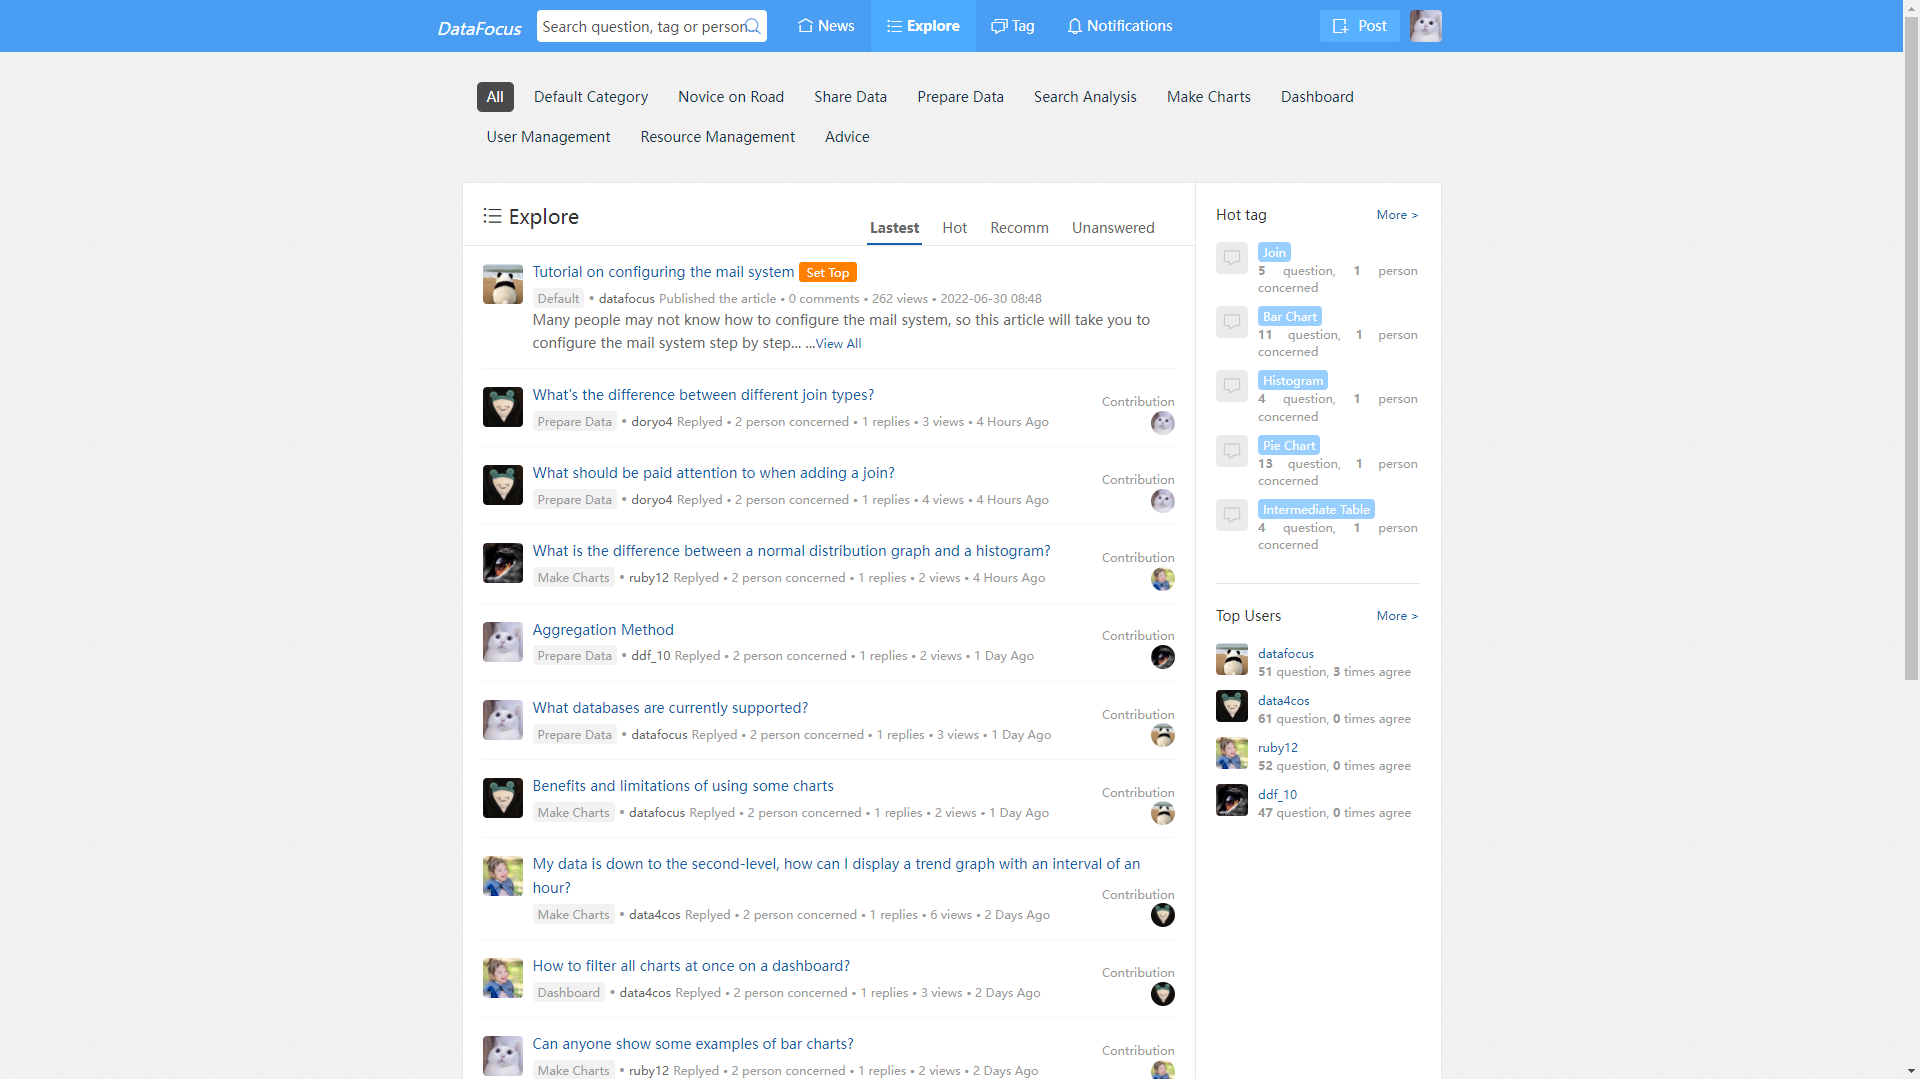
DFC uses two navigation bars, top and left. Similarly, the left one displays 10 different function modules like “Search”, “Answer”, etc., as shown in figure 2-3. The top navigation bar exhibits important dashboards set by users to check at any time, and some buttons for help documents.
2.1.2 Data
The interface of data tables is introduced here.
-
Amazon QuickSight
There are mainly two pages for the data table, information and editing page. As shown in figure 2-5, the information page lists the summary, refresh schedule, permission, and usage of the table. While the editing page is where you can process the data, including adding calculated fields, filters, data, preview data, etc.
GIF Figure 2-5 Data table info - Amazon QuickSight 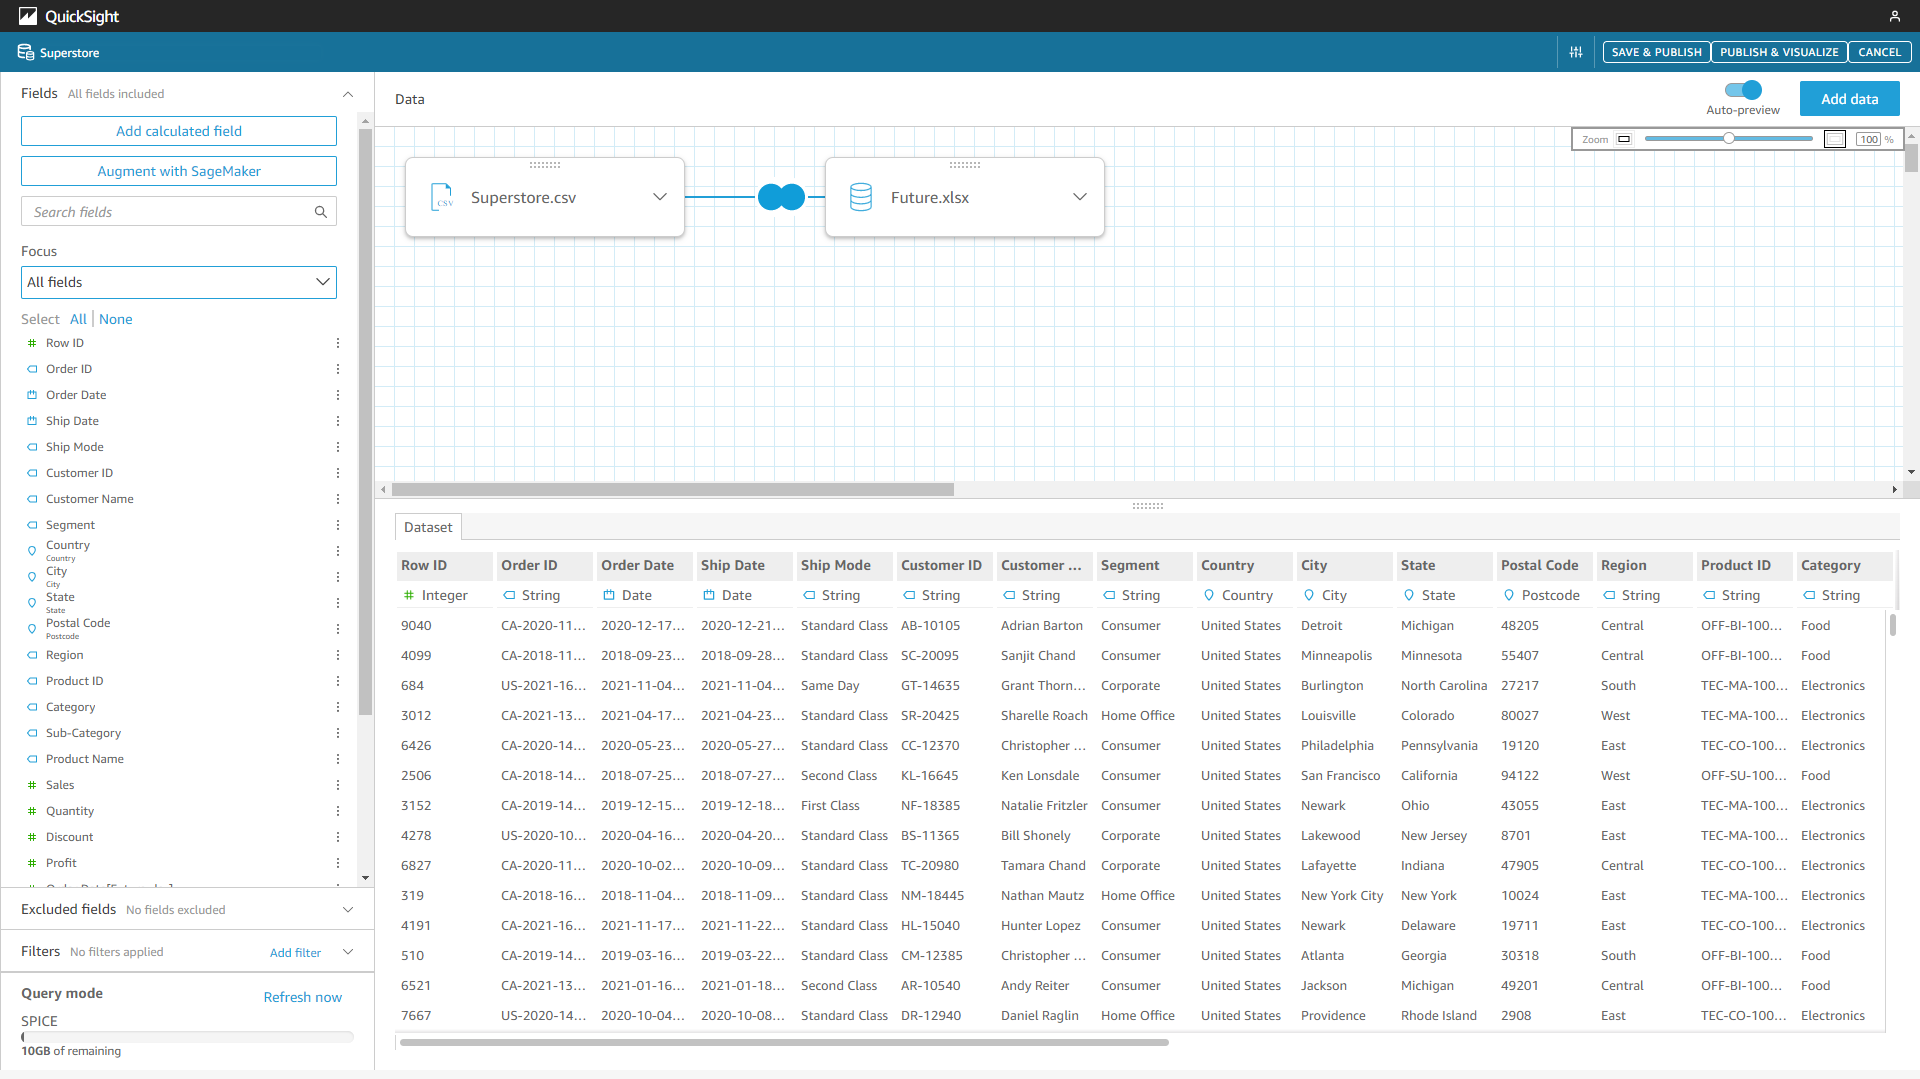
Figure 2-6 Data table edit - Amazon QuickSight -
DataFocus Cloud
The table module lists all data tables in the system. The information page of the data table displays the column information, relationships, data preview, and dependent resources. Other features from this page include adding/overlaying data, auto analysis, etc. Data processing in DFC is mainly on the search module, which will be discussed later.
GIF Figure 2-7 Data table module
2.1.3 Resource
-
Amazon QuickSight
Resources can be divided into four parts, datasets, analyses, dashboards, and topics. Datasets list all data tables, analyses are the data visualization, dashboards are published analyses only for interacting and topics are for getting value from natural language queries.
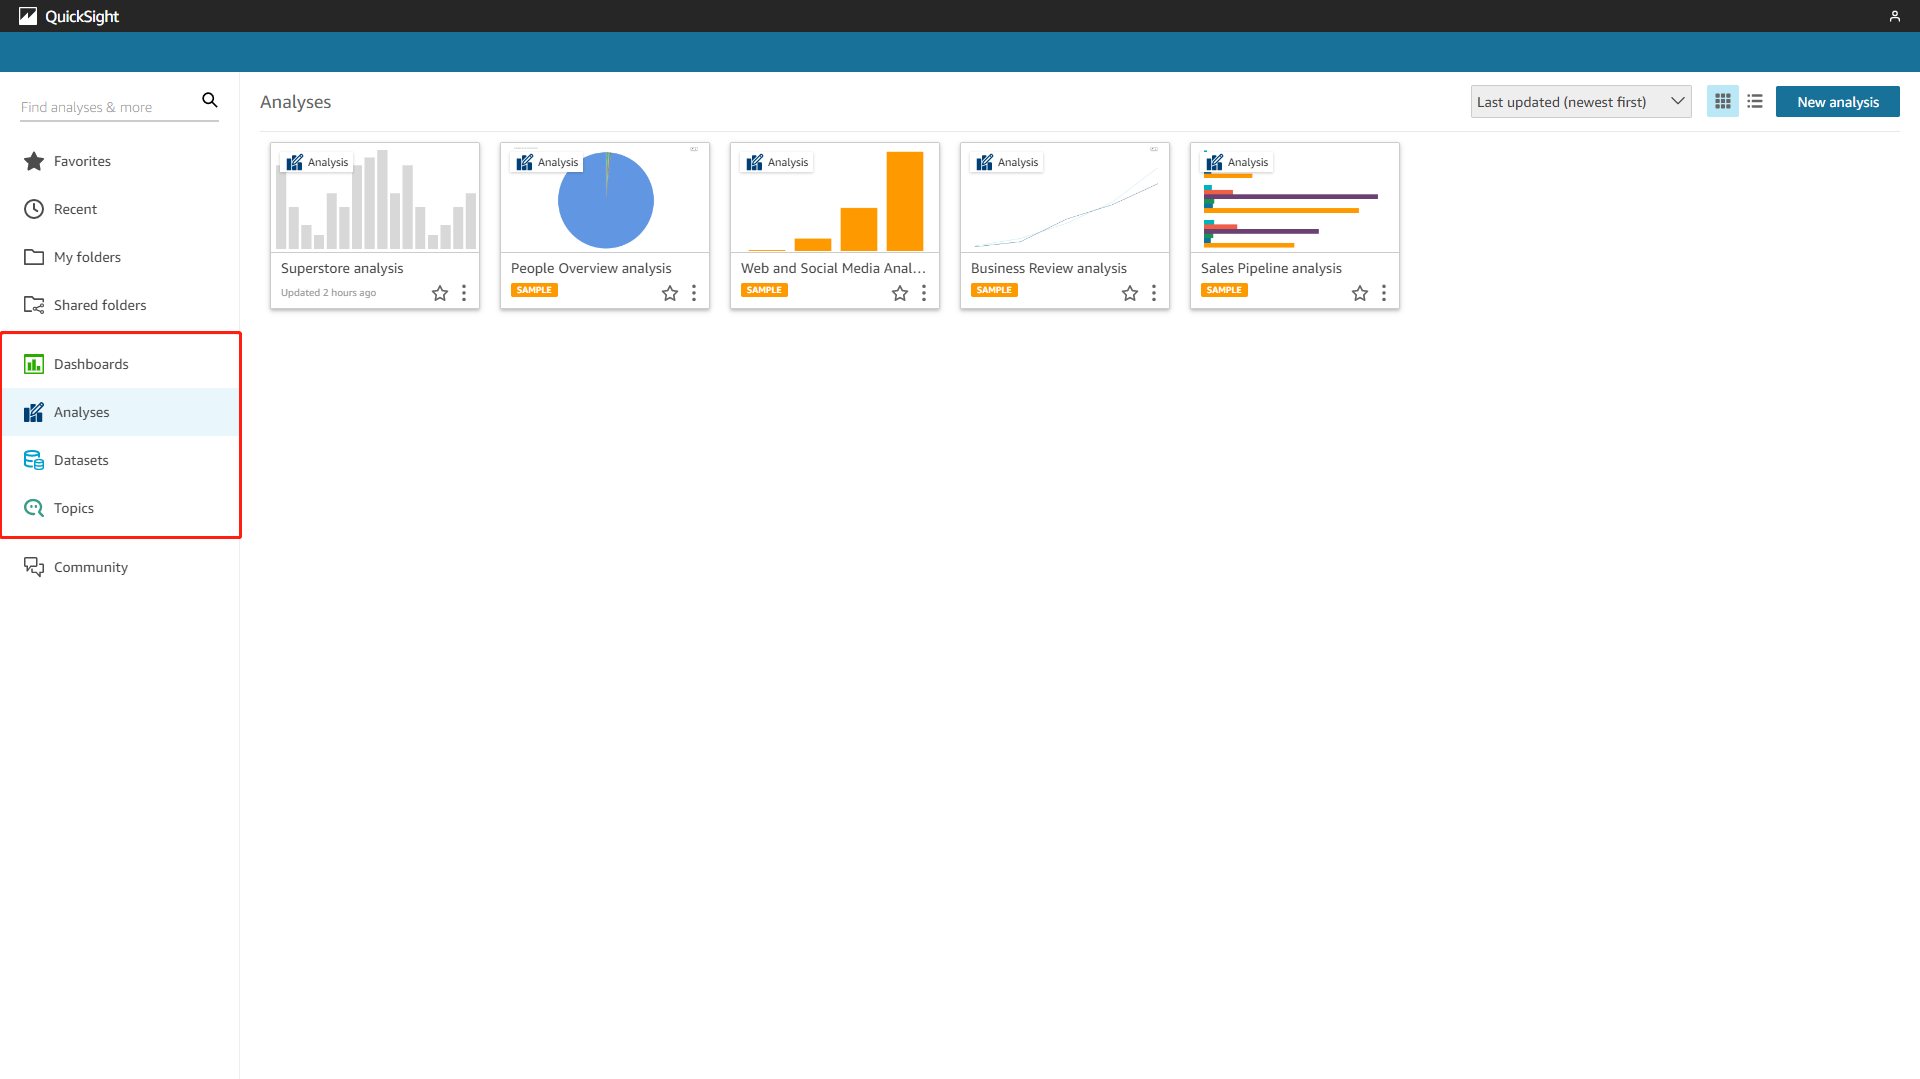
Figure 2-8 Resources - Amazon QuickSight -
DataFocus Cloud
Resources mainly include data tables, answers, and dashboards. Answers are analyzed charts from searching, and dashboards are the visualization board explaining the findings from the data. Each resource has a separate module, and there is a resource module that displays all kinds of resources. You may switch the mini navigation bar to view different resources.
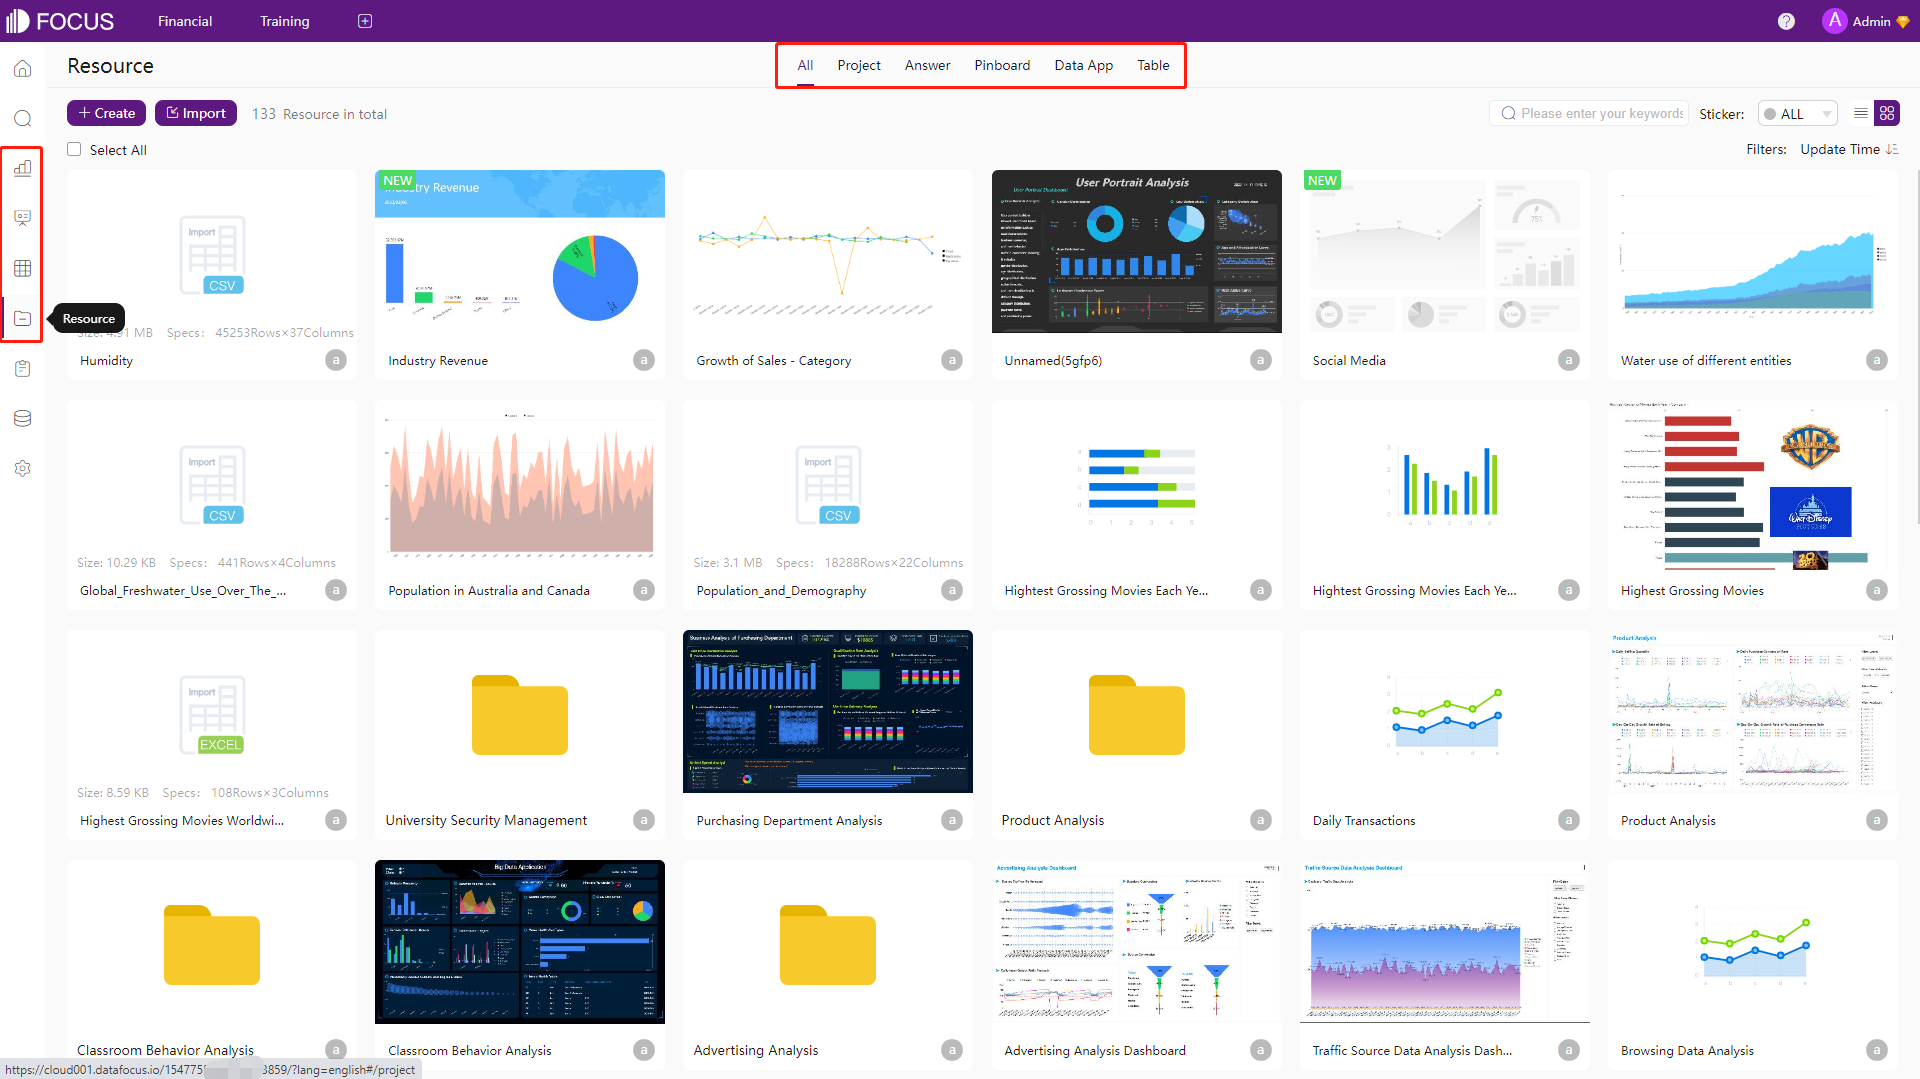
Figure 2-9 Resources - DFC
2.1.4 Analytics
-
Amazon QuickSight
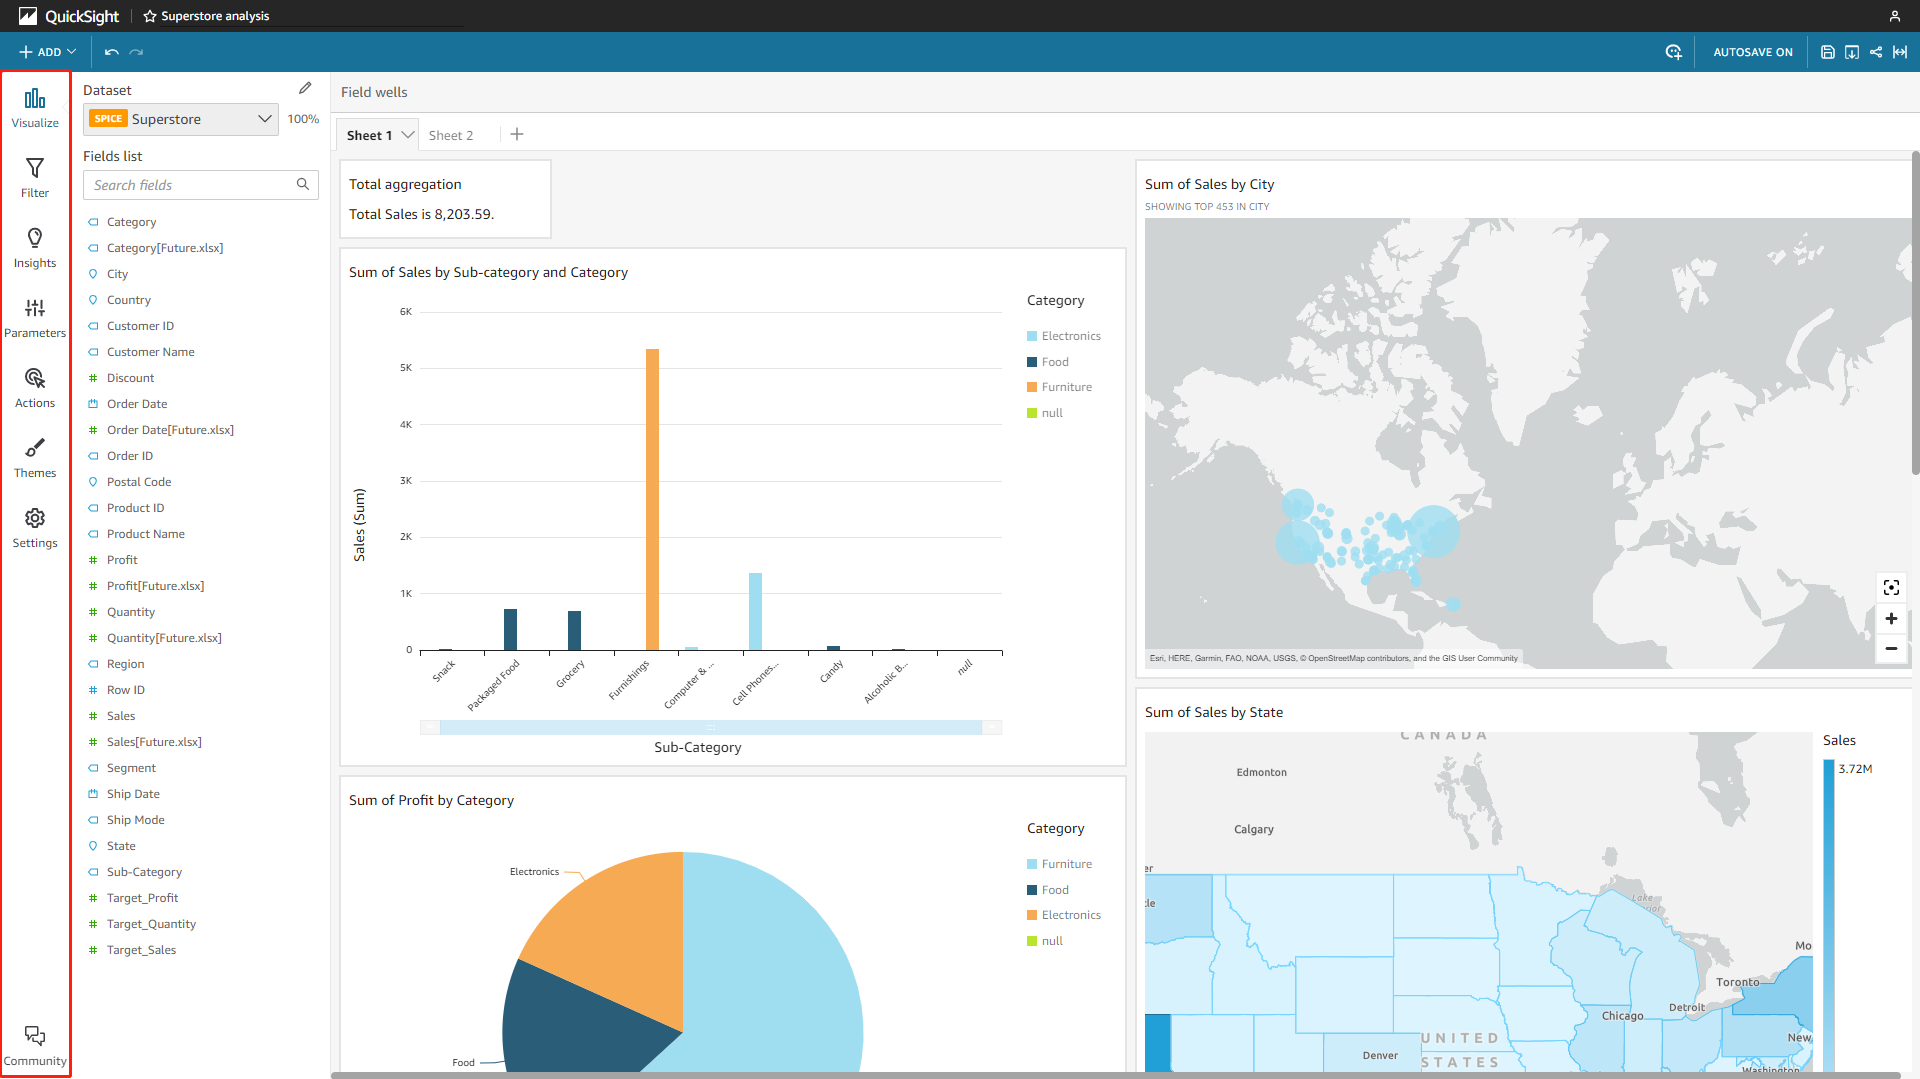
As mentioned before, analyses in Amazon QuickSight are dashboards being edited, and each analysis would contain multiple charts. Except for the analyses, there is also QuickSight Q, where you can use natural language to get results. The analysis page mainly consists of navigation bars, the fields list, and the sheet canvas, as shown in figure 2-10. The search bar is the QuickSight Q search, and it is only for the enterprise edition.
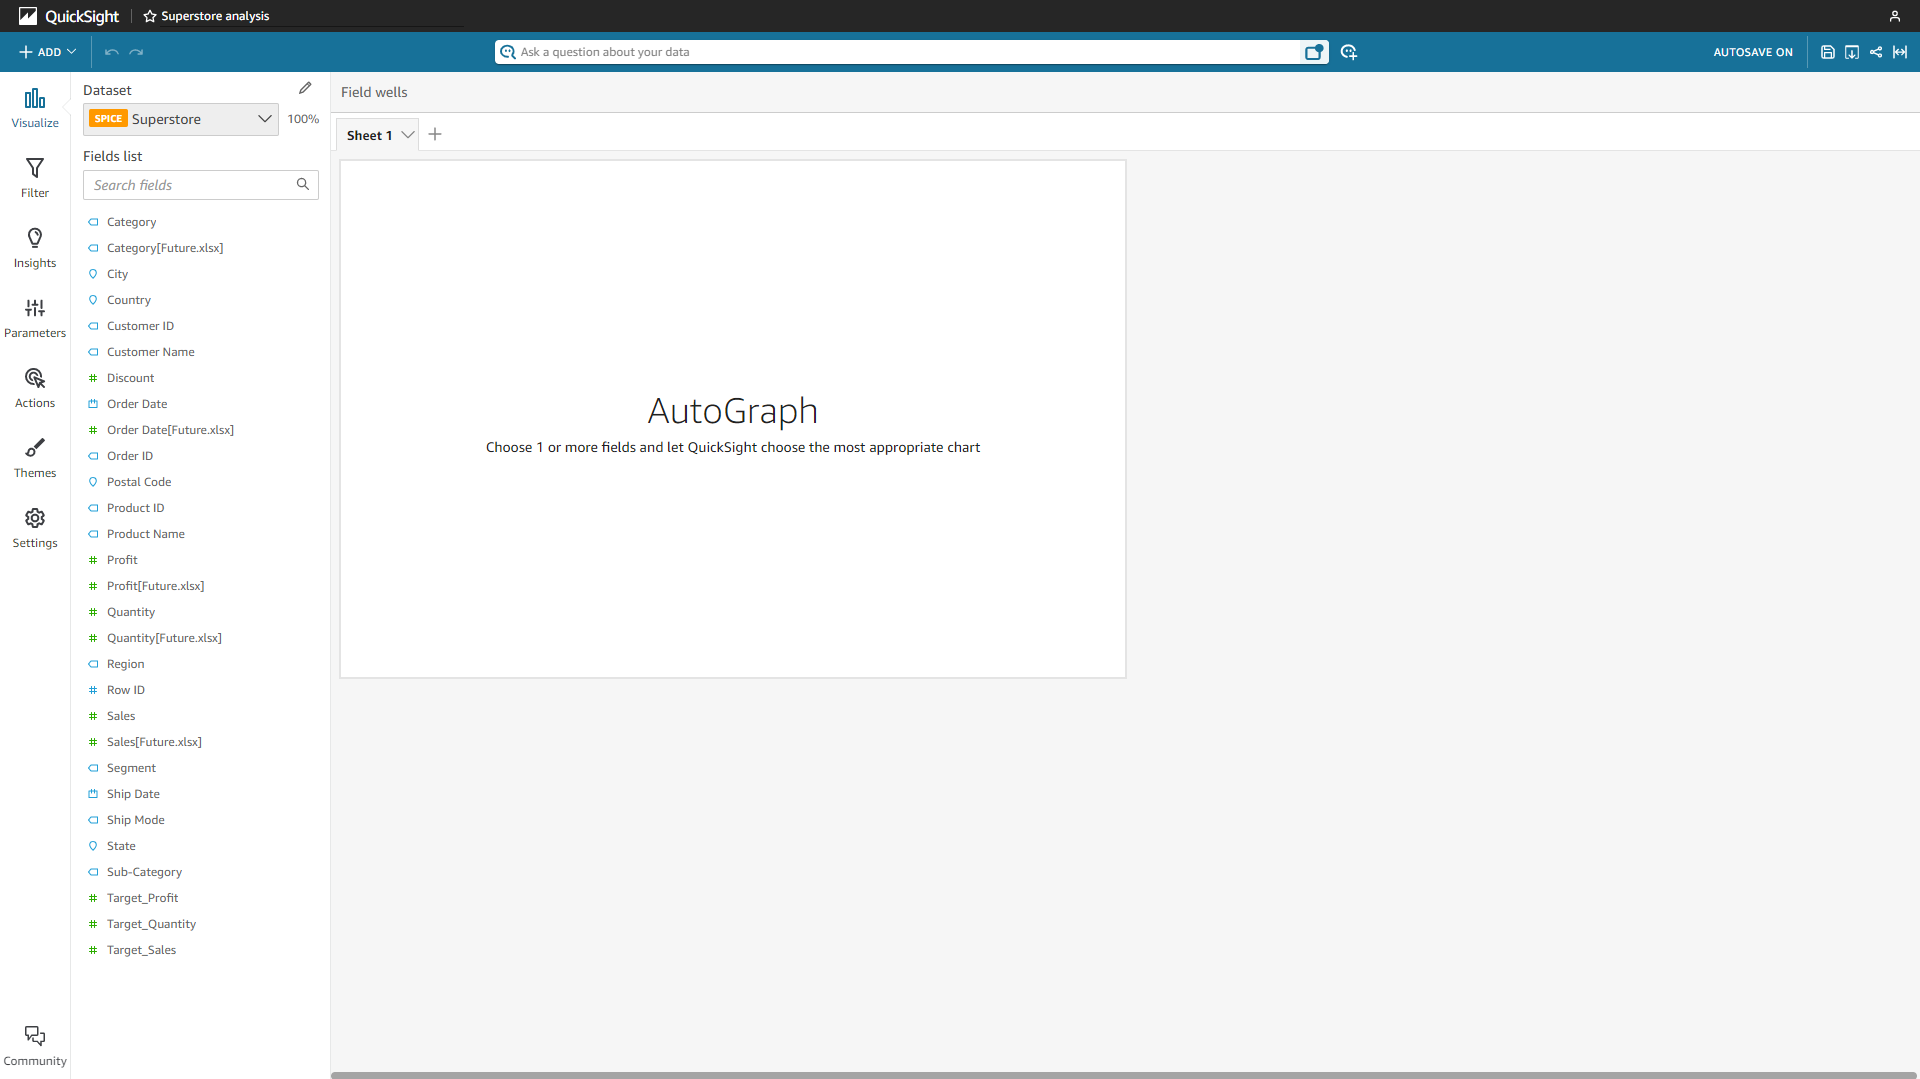
Figure 2-10 Analytics - Amazon QuickSight -
DataFocus Cloud
There is a search analysis module in DFC’s system, where you can analyze data using search (nearly natural language) and make visualization charts. Except for the navigation bars, there are table columns, a search bar, and a canvas on the module. Columns are shown as attributes and measures, the search bar is where users can type in the analysis, and the canvas is for the chart display as well as some configurations.
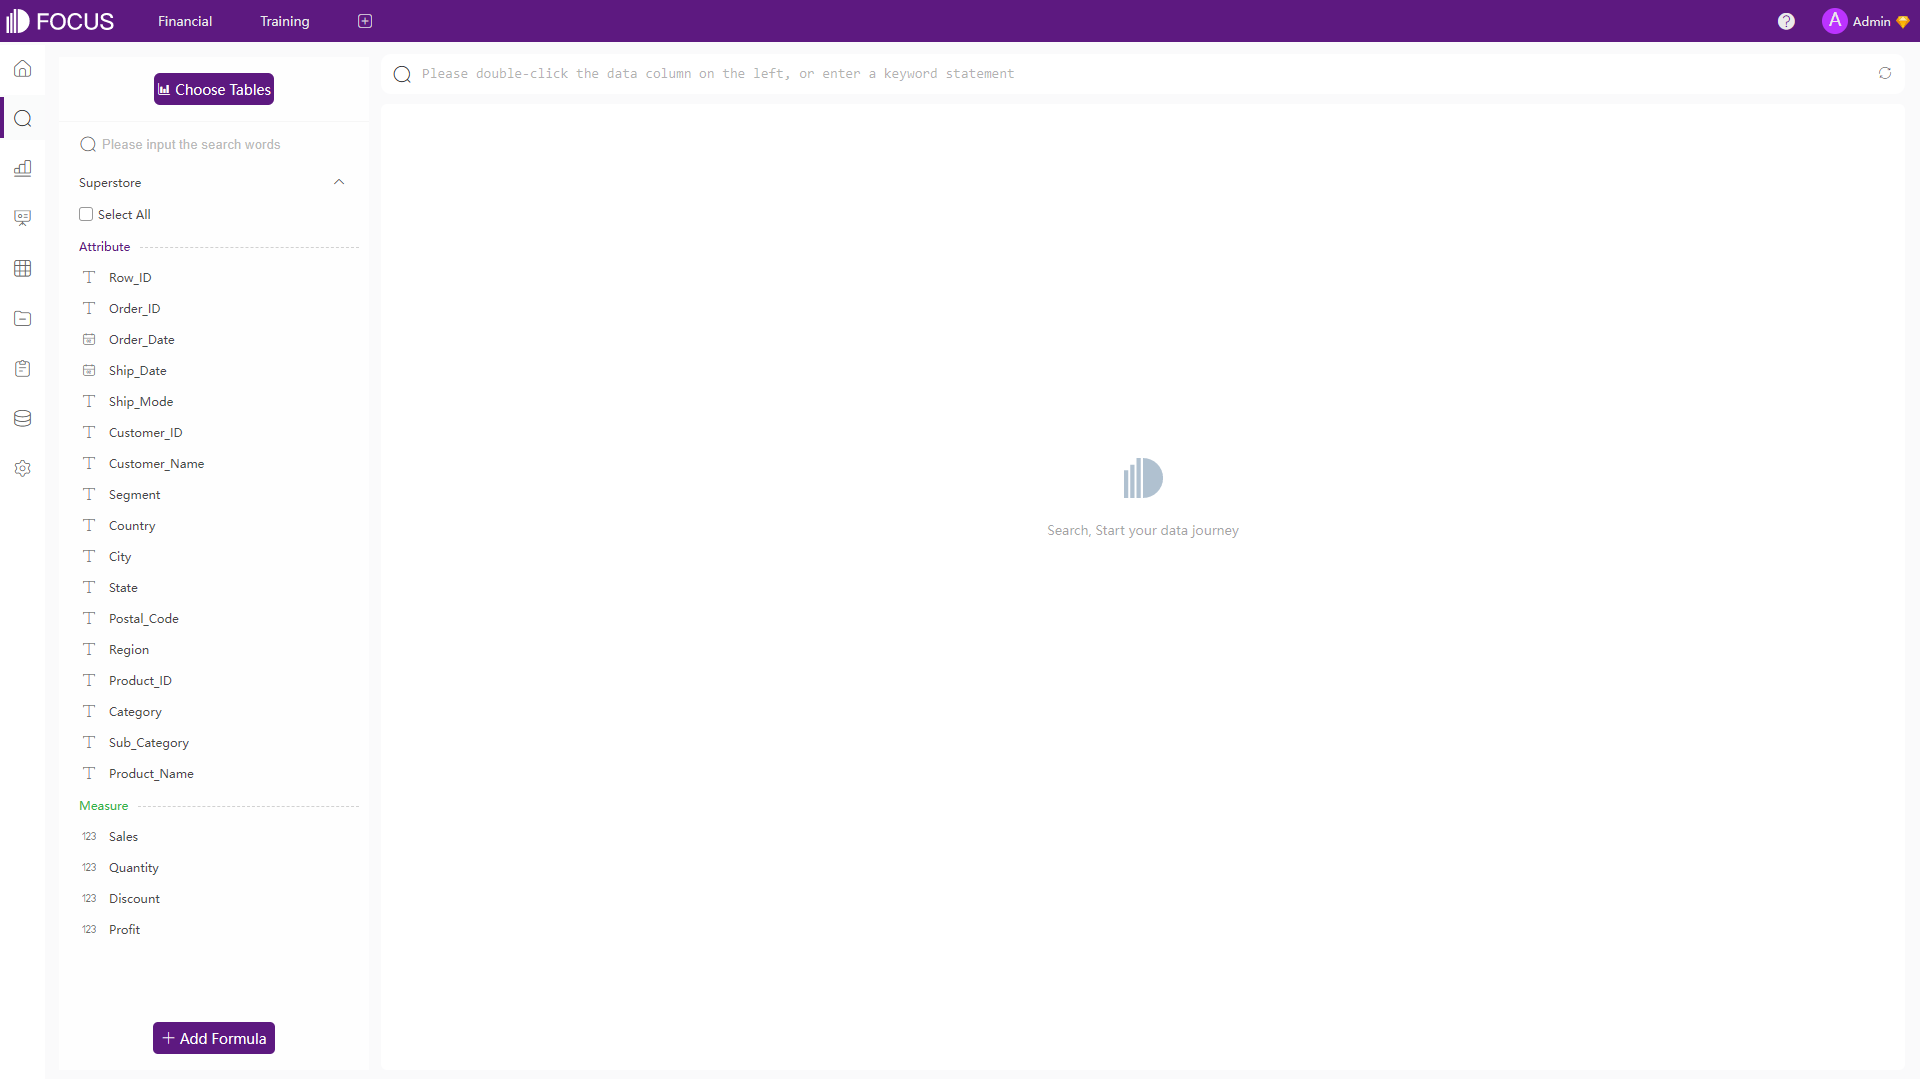
Figure 2-11 Analytics - DFC
2.1.5 Community
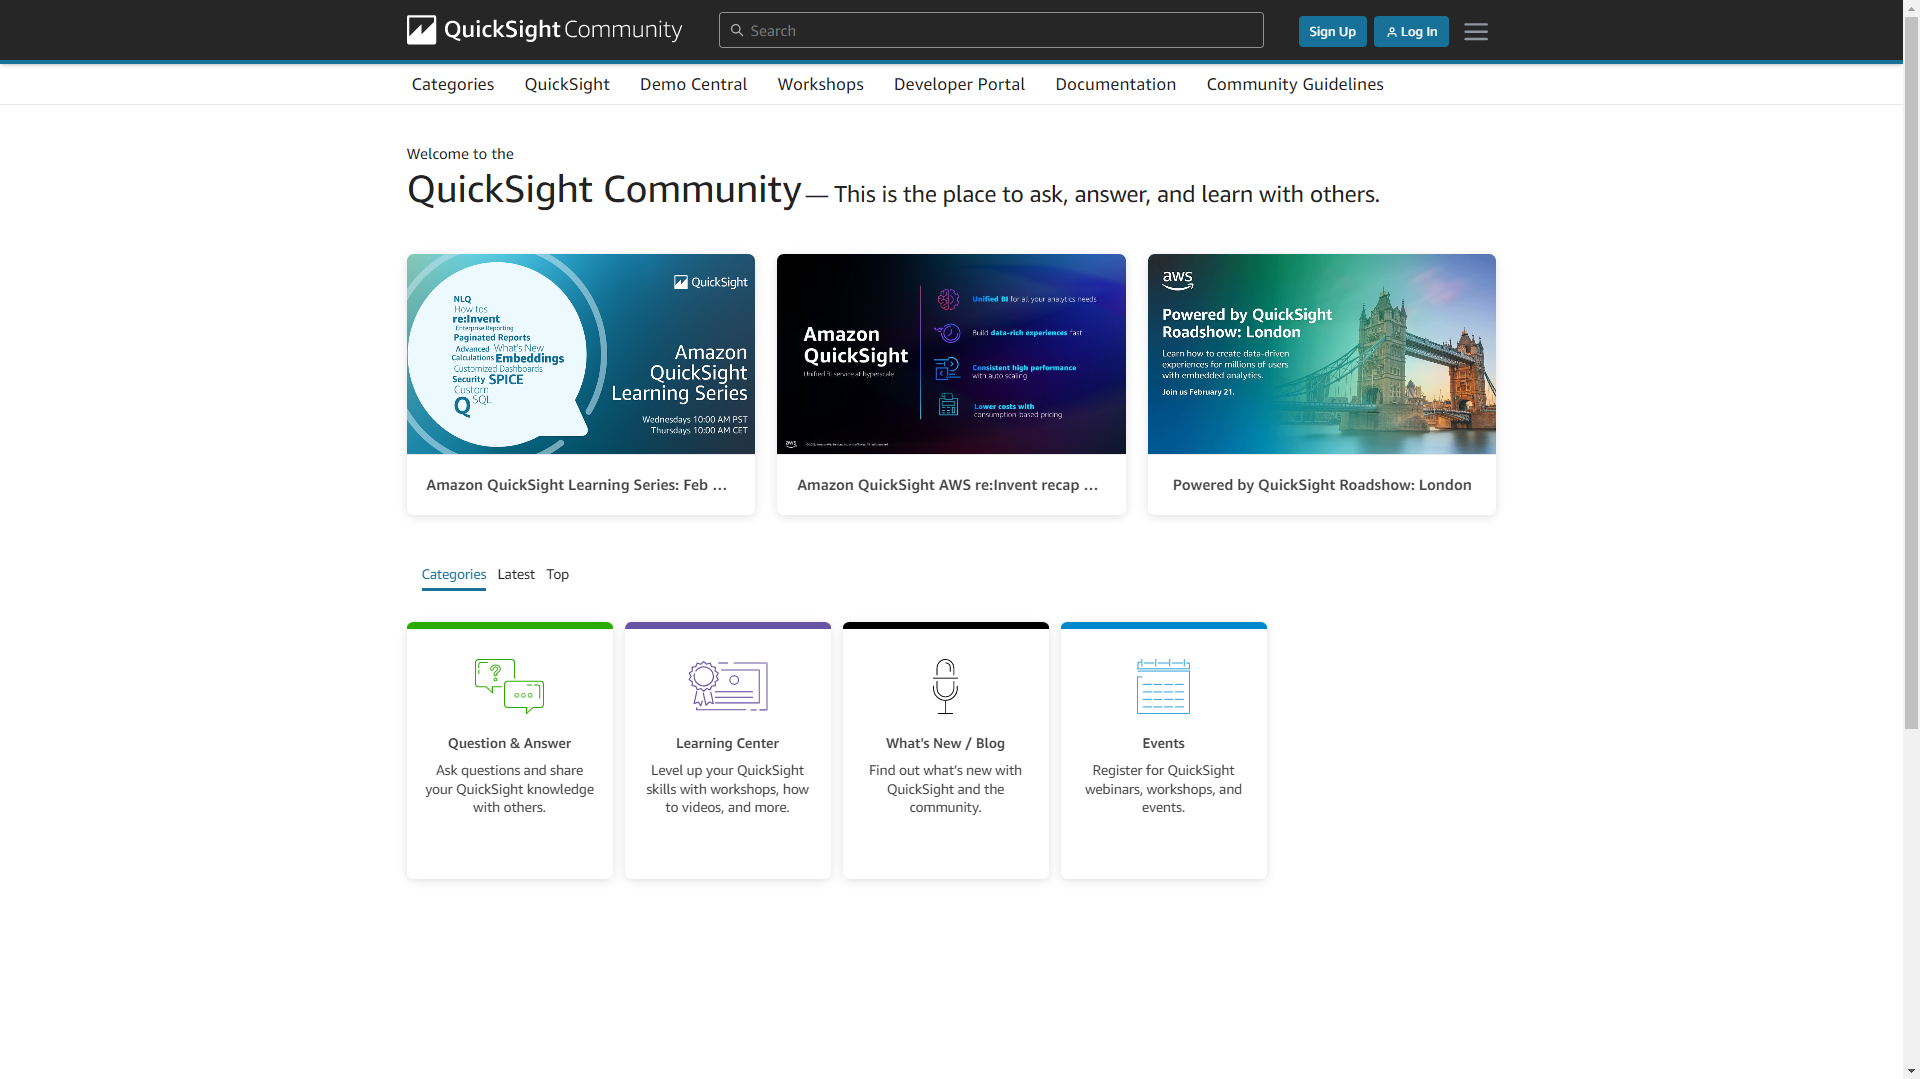
Both Amazon QuickSight and DataFocus Cloud offer a community to help users communicate with each other and search some answers when facing problems.
2.2 Data Source
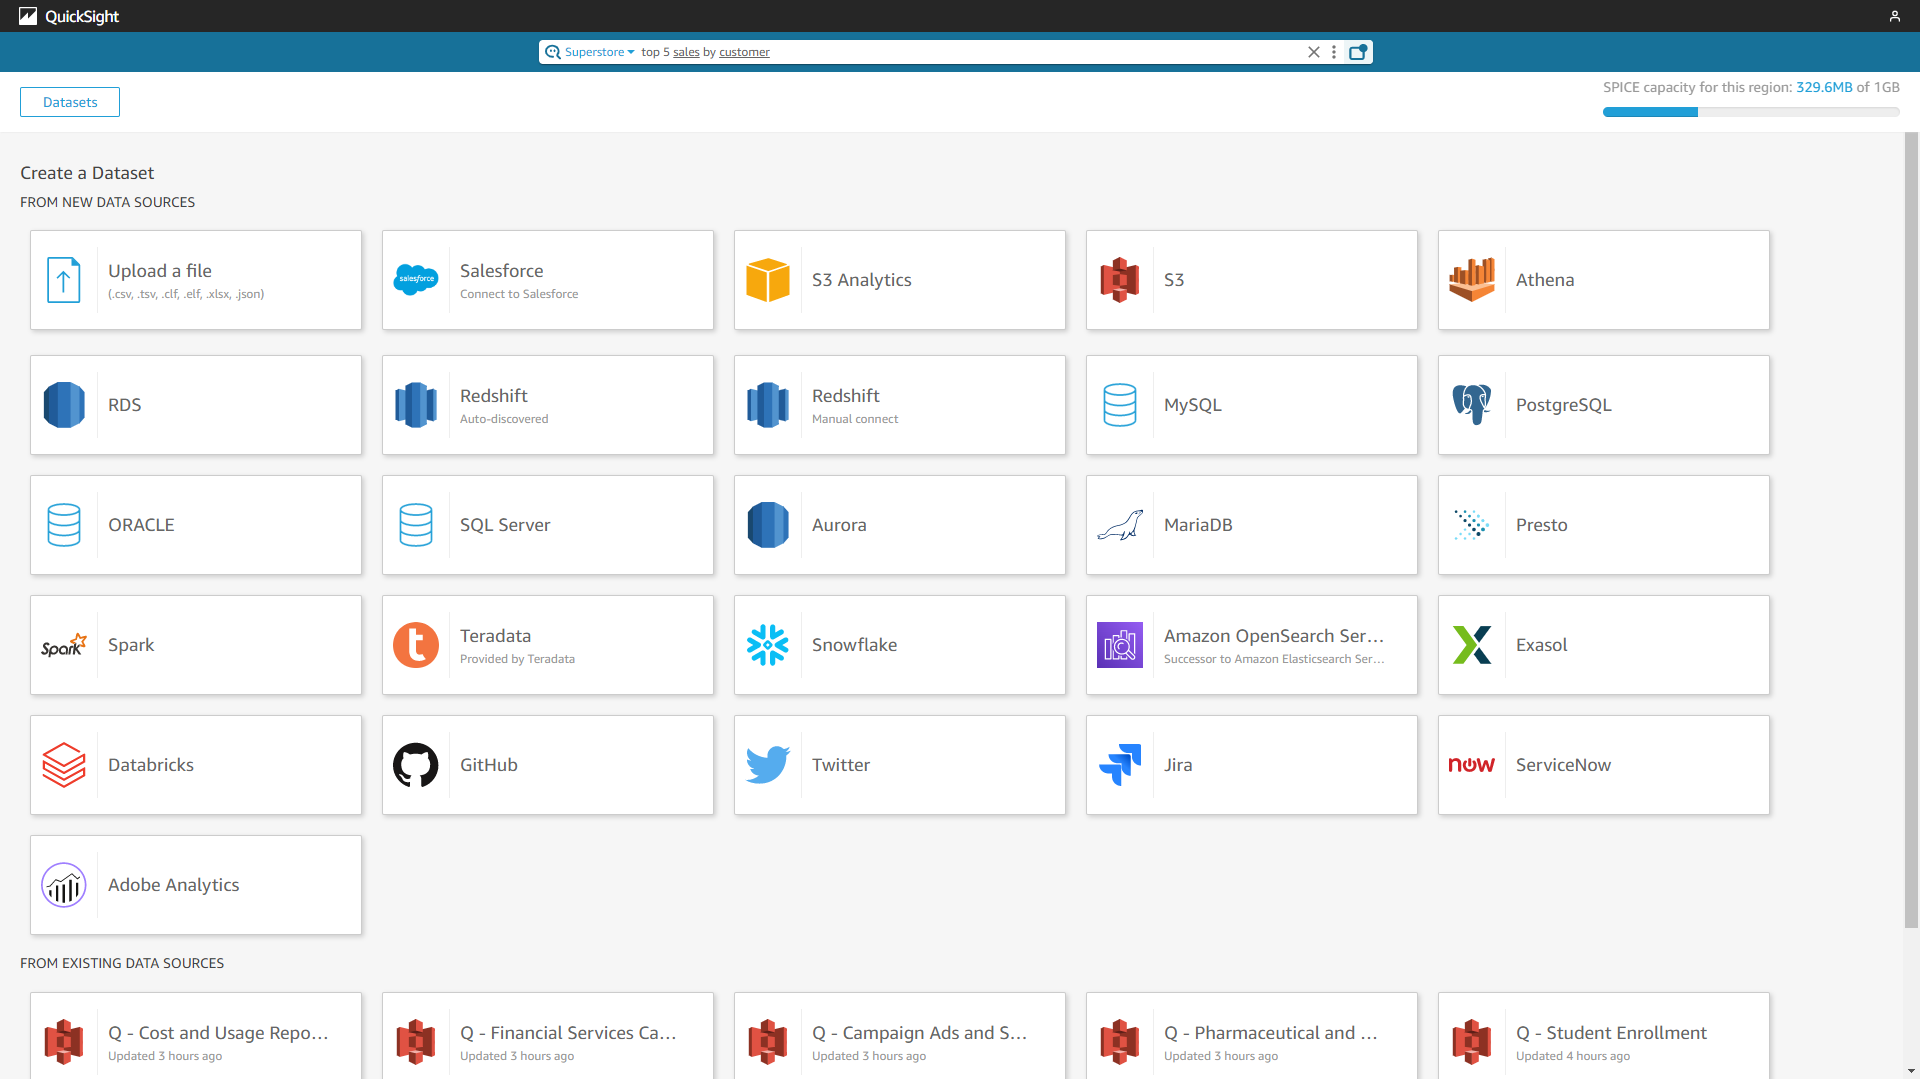
Both Amazon QuickSight and DataFocus Cloud support uploading local files and connecting to different data sources such as databases like MySQL and Oracle.
The differences are:
- Amazon QuickSight also supports Software as a Service (SaaS) data sources, such as Jira and Salesforce, while DFC also supports using API to access reliable data sources.
- When connecting to databases, DFC offers two ways to obtain data, connect and import. Connect is to get data in real-time, while import is to upload the tables from the database to the system.
-
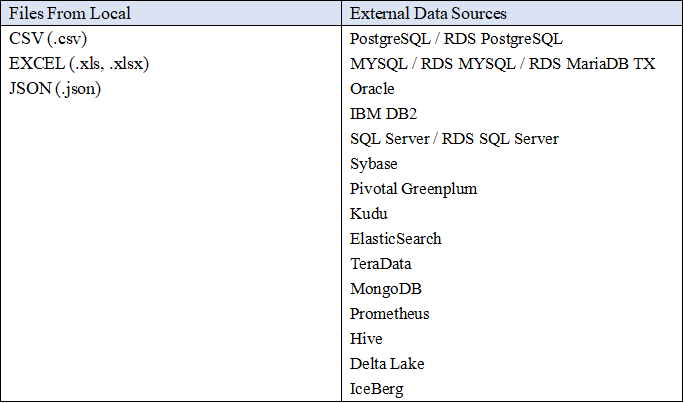
In terms of local files, Amazon QuickSight supports six different types of files, and DFC supports four. However, in DFC, users can use different file encodes. Also, when importing excel files into DFC’s system, users can upload up to 10 sheets at the same time.
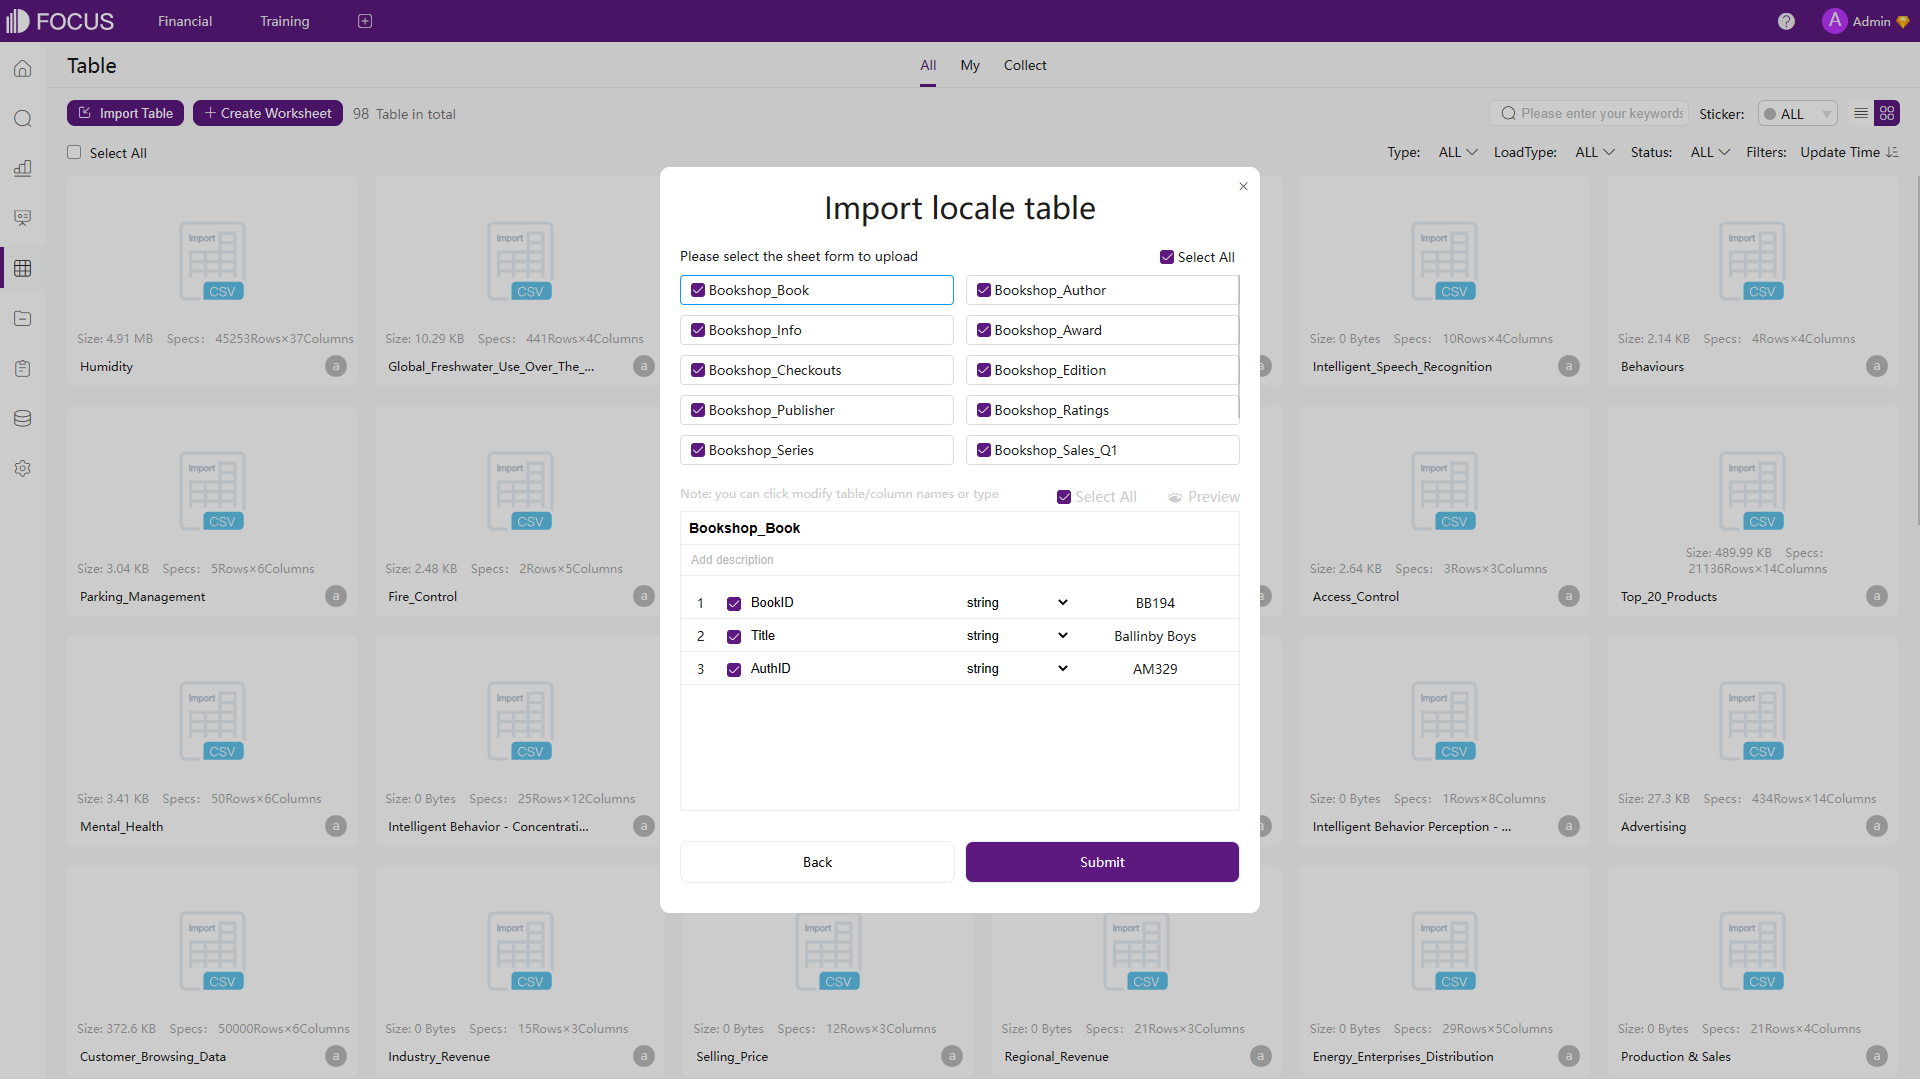
Figure 2-16 Upload Excel Sheets - DFC -
The upload settings are shown below, users can change the format, qualifier, and etc. DFC also provides some more setting options.
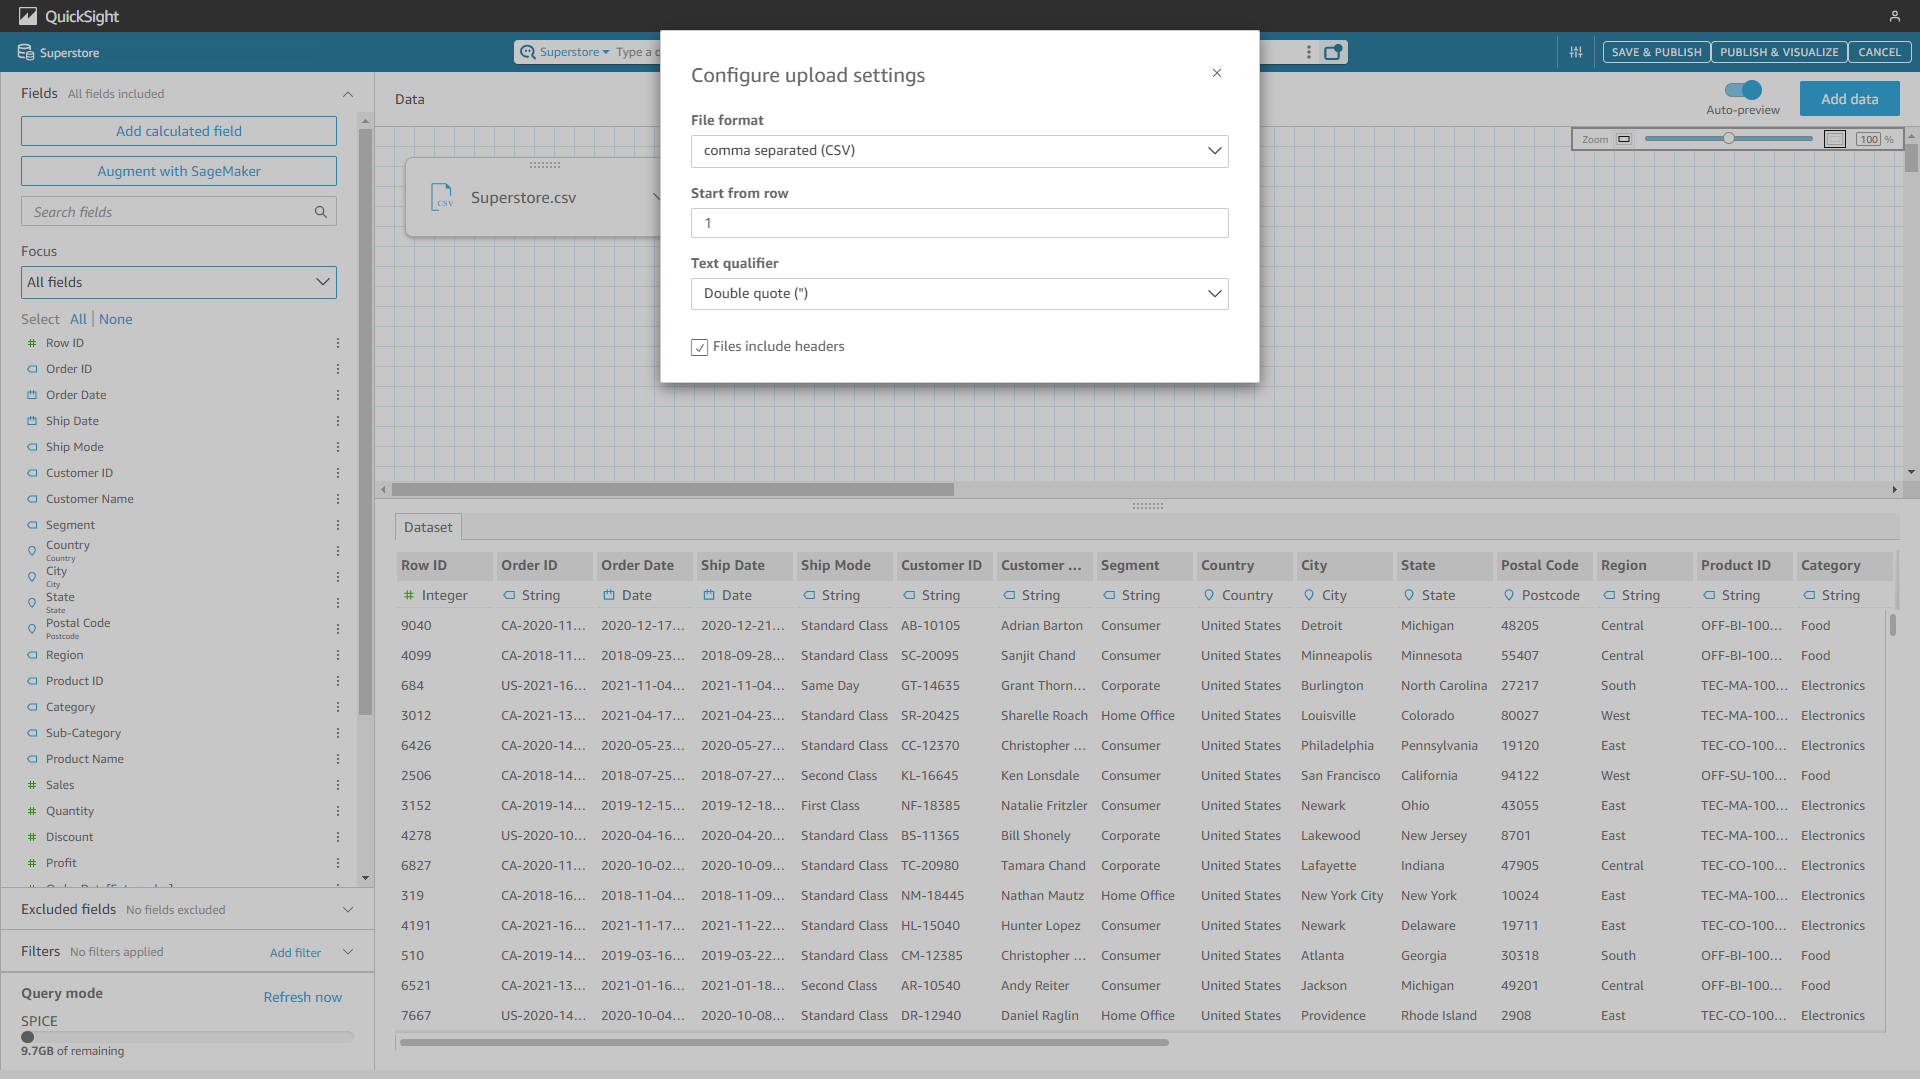
Figure 2-17 Upload settings - Amazon QuickSight 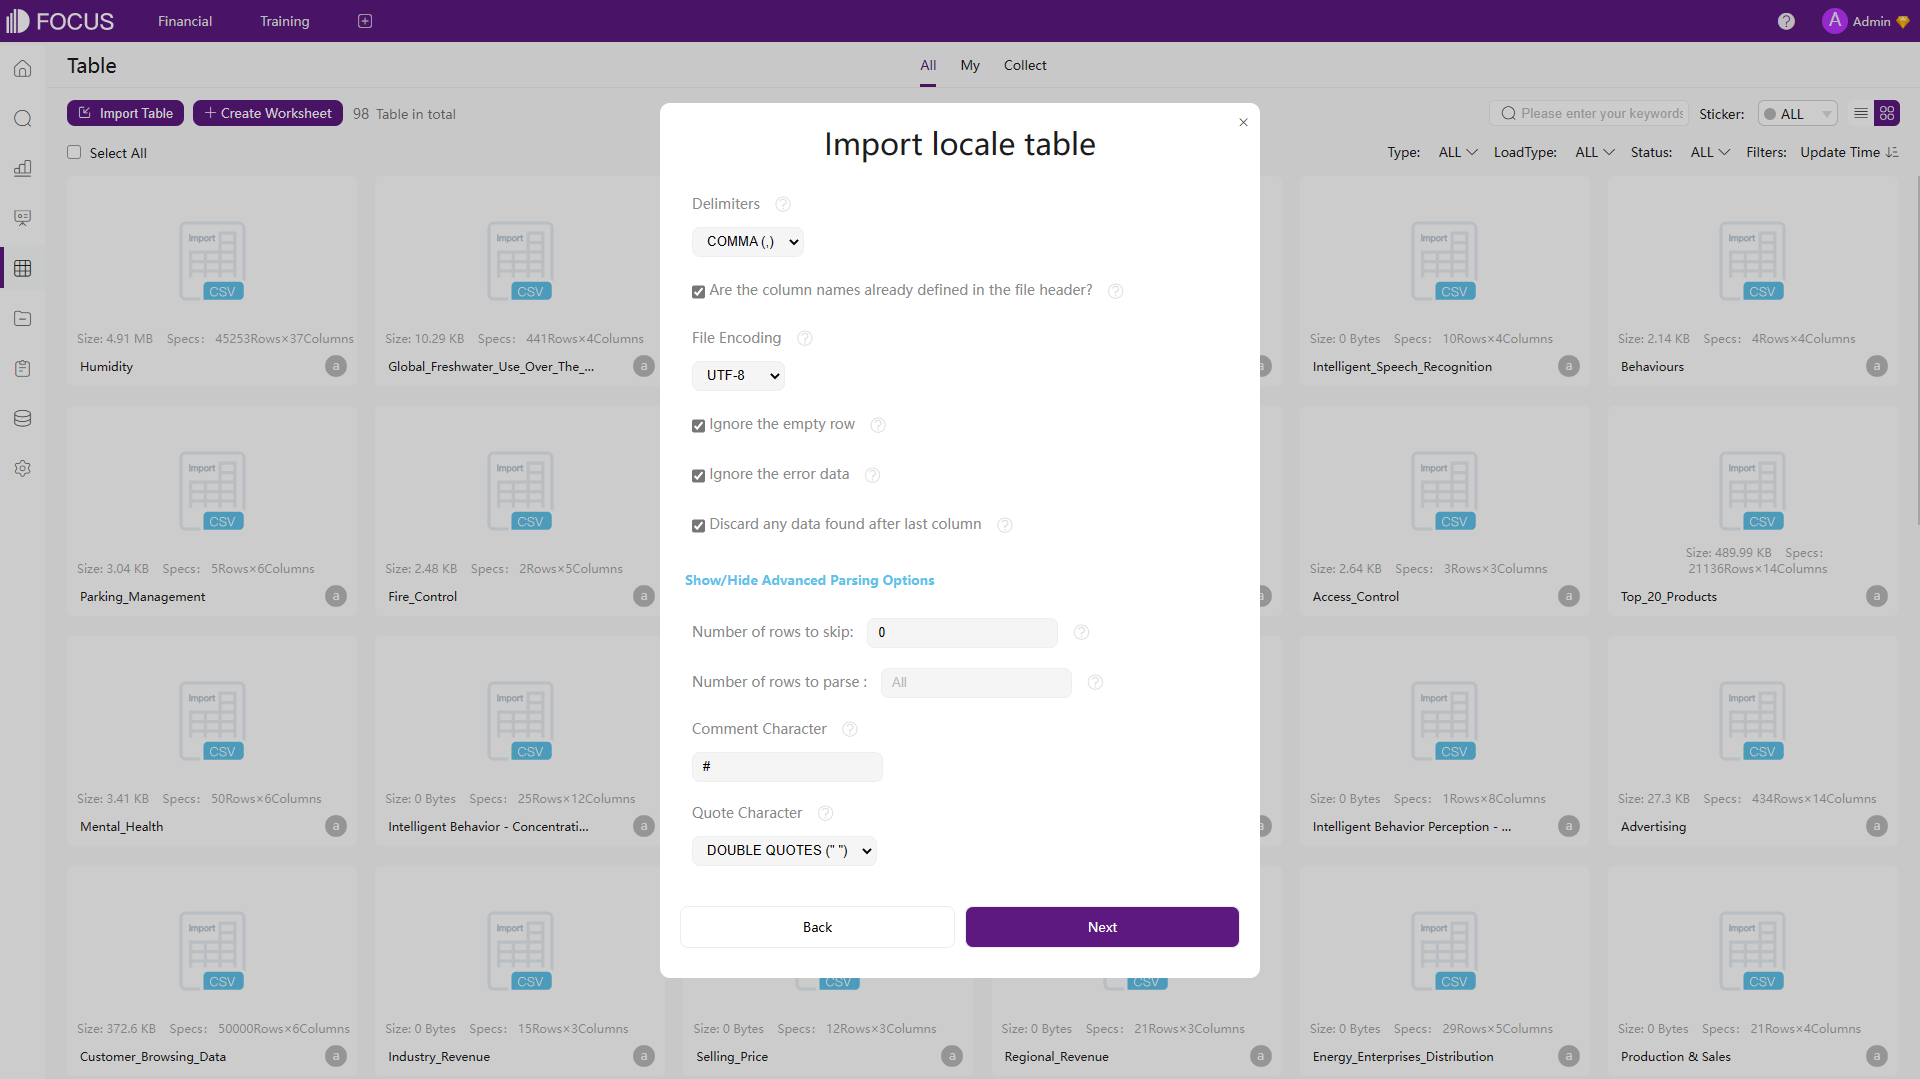
Figure 2-18 Upload settings - DFC - Both tools can update/overlay the table, and users can add new data to the existing table.
2.3 Ease of Use
2.3.1 Analytics
-
Amazon QuickSight
To analyze and visualize data, there are mainly two ways in Amazon QuickSight.
-
Analyses
One analysis can contain multiple charts. For each chart, you can either drag and drop to add fields, or click the field name on the left side of the page, as shown below.
GIF Figure 2-19 Analyses - Amazon QuickSight -
QuickSight Q
For the enterprise edition, users can use QuickSight Q to analyze data. By typing a question in natural language, the system would return a chart, and users can choose to add it to an analysis or pin it to the pinboard (up to 30).
GIF Figure 2-20 QuickSight Q 1 - Amazon QuickSight Though users can add synonyms, select the semantic types, etc., sometimes the system may misunderstand the question and give out the wrong analysis.
GIF Figure 2-21 QuickSight Q 2 - Amazon QuickSight
-
-
DataFocus Cloud
DFC uses search as the interaction, and thus users only need to search to get the analysis. There are mainly two ways to add the columns, select and type. Then similar to Amazon QuickSight, the system would return a suitable graph according to the search.

GIF Figure 2-22 Analyses 1 - DFC The search is very close to natural language, but it has its own keyword rules to make the search more accurate.
GIF Figure 2-23 Analyses 2 - DFC Some complicated analyses can also be conducted easily by the system, such as calculating the quarterly growth amount.
GIF Figure 2-24 Complicated analyses - DFC
2.3.2 Filter
-
Amazon QuickSight
Filters can be added to a dataset or an analysis.
-
Dataset
Filters can be added directly to a dataset, then the analyses made according to the dataset would be filtered as well.
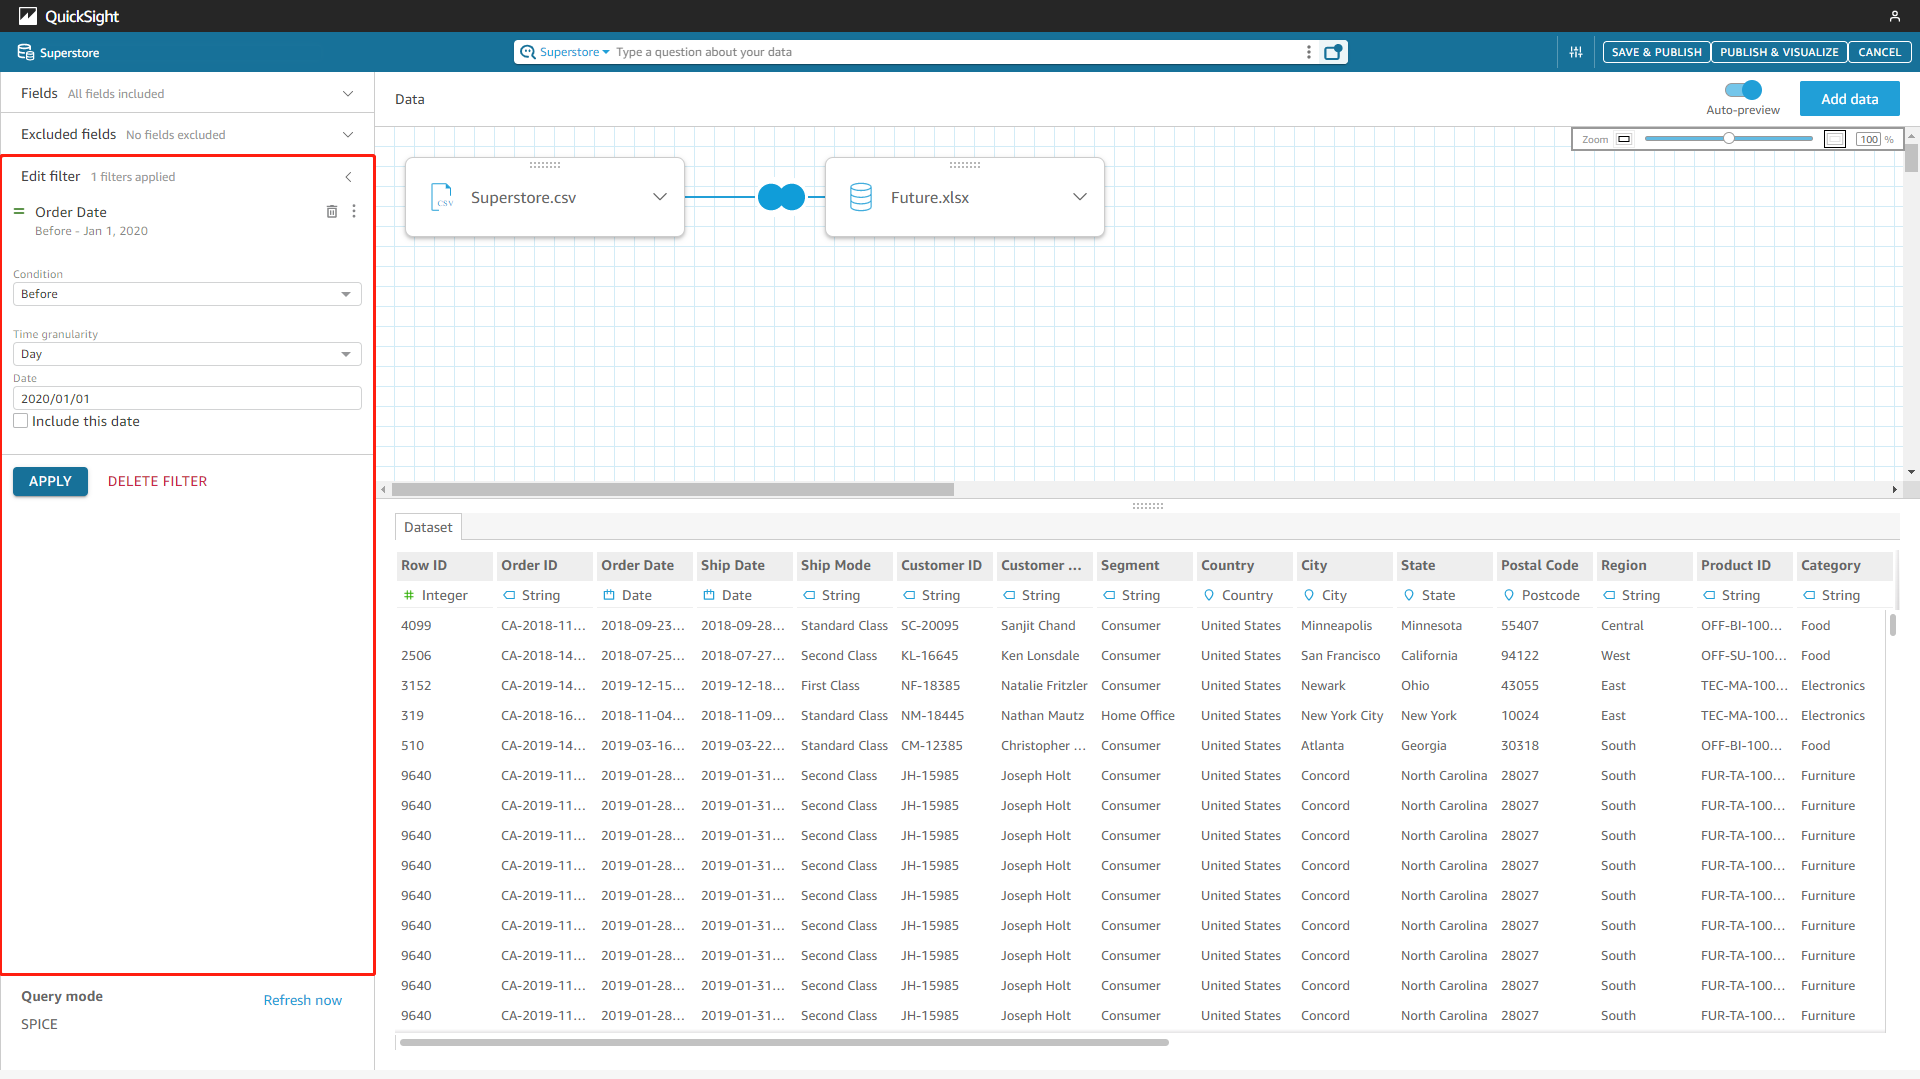
Figure 2-25 Dataset filter - Amazon QuickSight -
Analyses
Filters can be added to analyses, and users can choose to apply the filter to certain charts or all charts, etc.
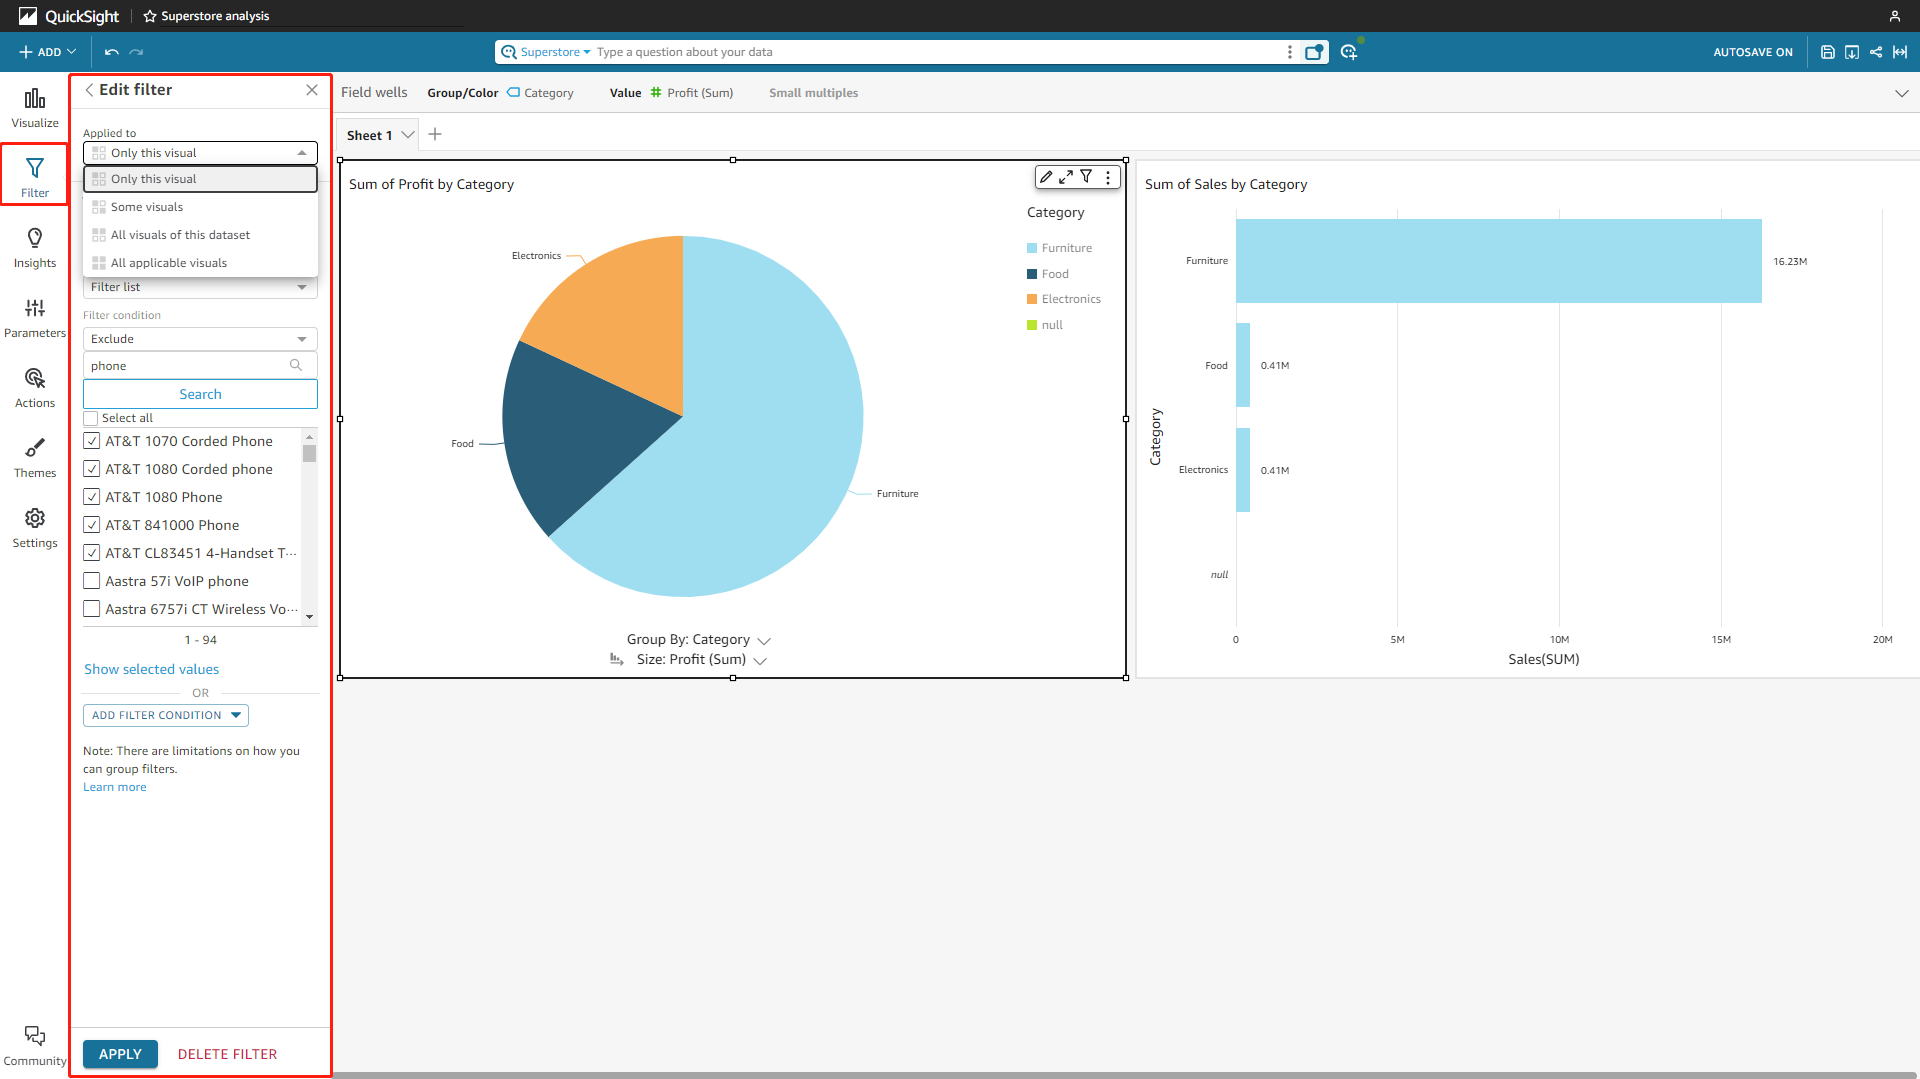
Figure 2-26 Analyses filter - Amazon QuickSight -
Filter Control
Filter controls can be added to the analysis sheet, and viewers can interact with them to filter the charts. The controls can be added to any place on the canvas, or pinned to the top, as shown in figure 2-27.
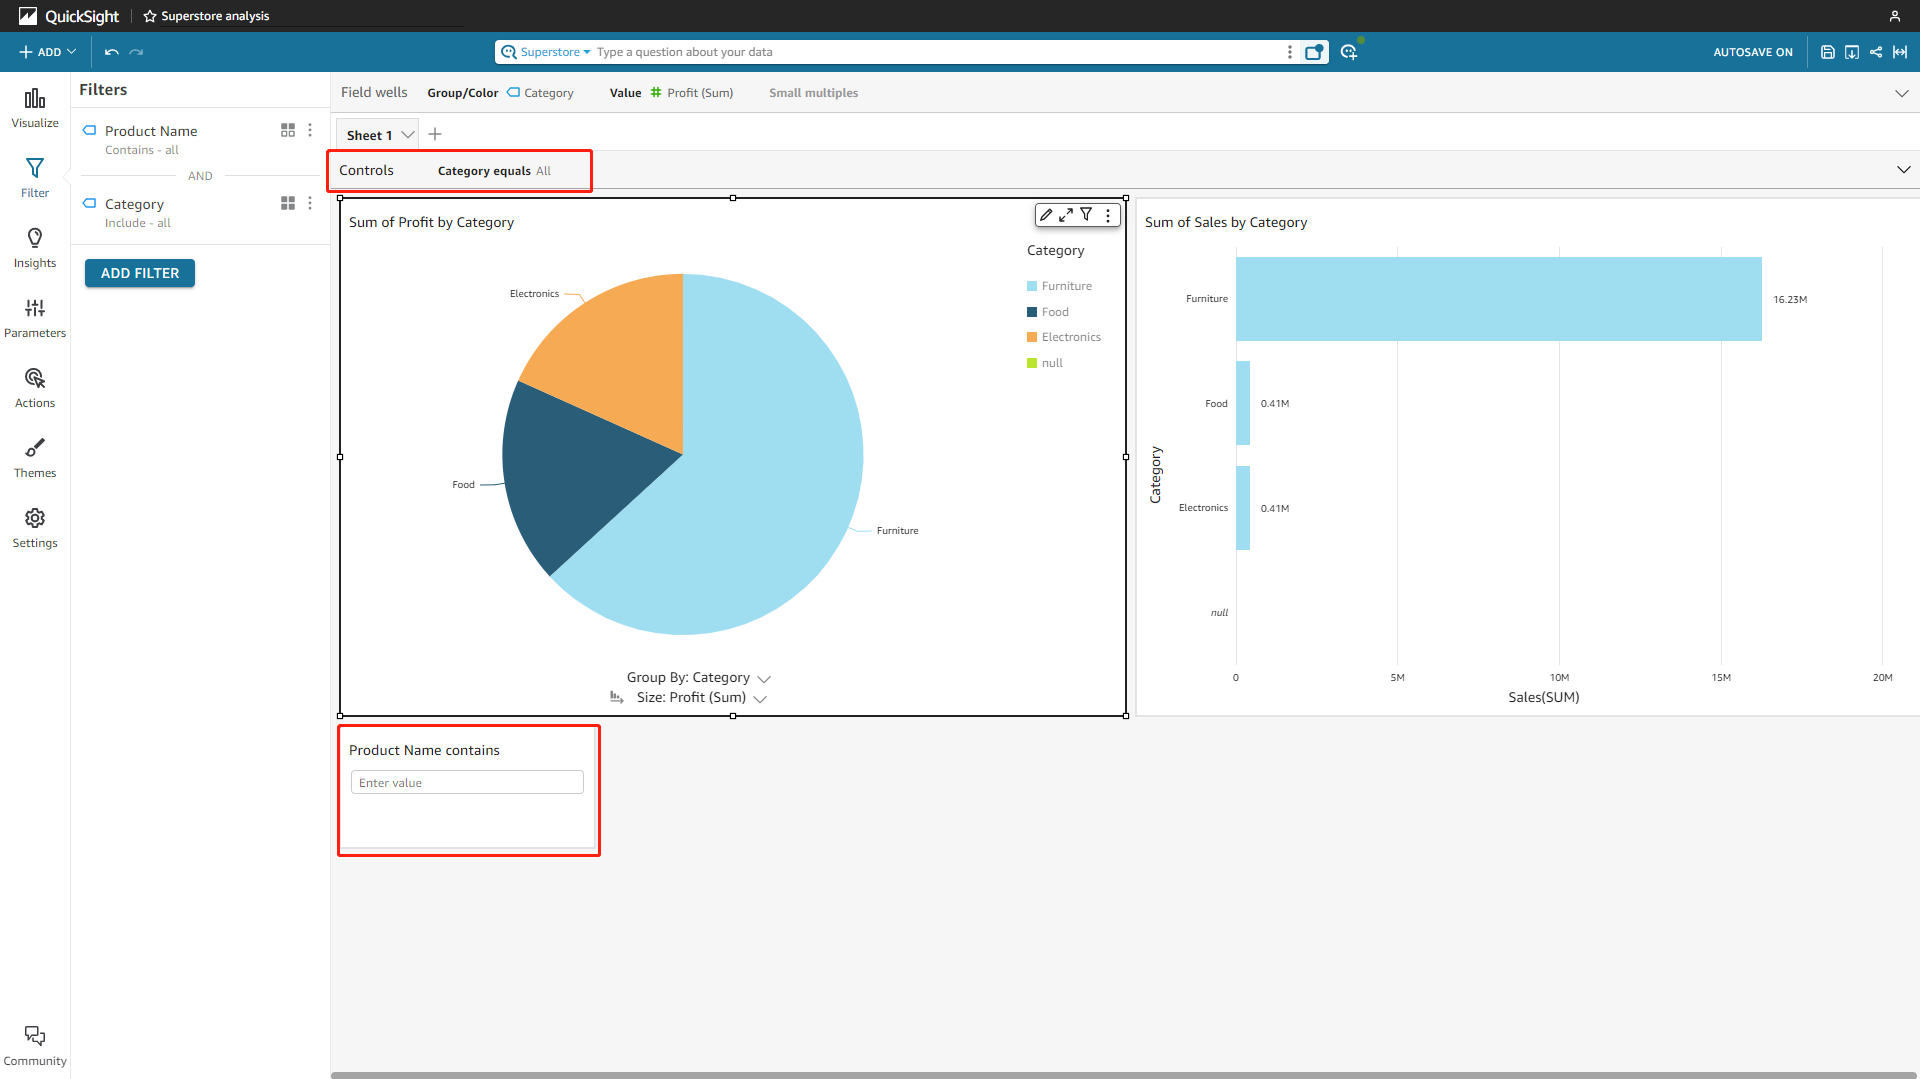
Figure 2-27 Filter control - Amazon QuickSight
-
-
DataFocus Cloud
Similarly, filters can be applied to data tables, answers (charts), or dashboards.
-
Intermediate Tables
Instead of changing directly on the dataset, DFC uses intermediate tables. There are two types of intermediate tables, and users can first filter or process the data and save it as an intermediate table. Then the intermediate table can be used as the dataset to do further analysis.
GIF Figure 2-28 Intermediate tables -
Answers
-
Keywords
Keywords can be regarded as filters. For example, use the keyword “contains” to filter different texts, as shown below.
GIF Figure 2-29 Keyword -
Filter on Charts
Similar to filters on analyses of QuickSight, filters can be added to charts. For tables, filters can be added through the settings button of each column, while filters are added through axes for charts.
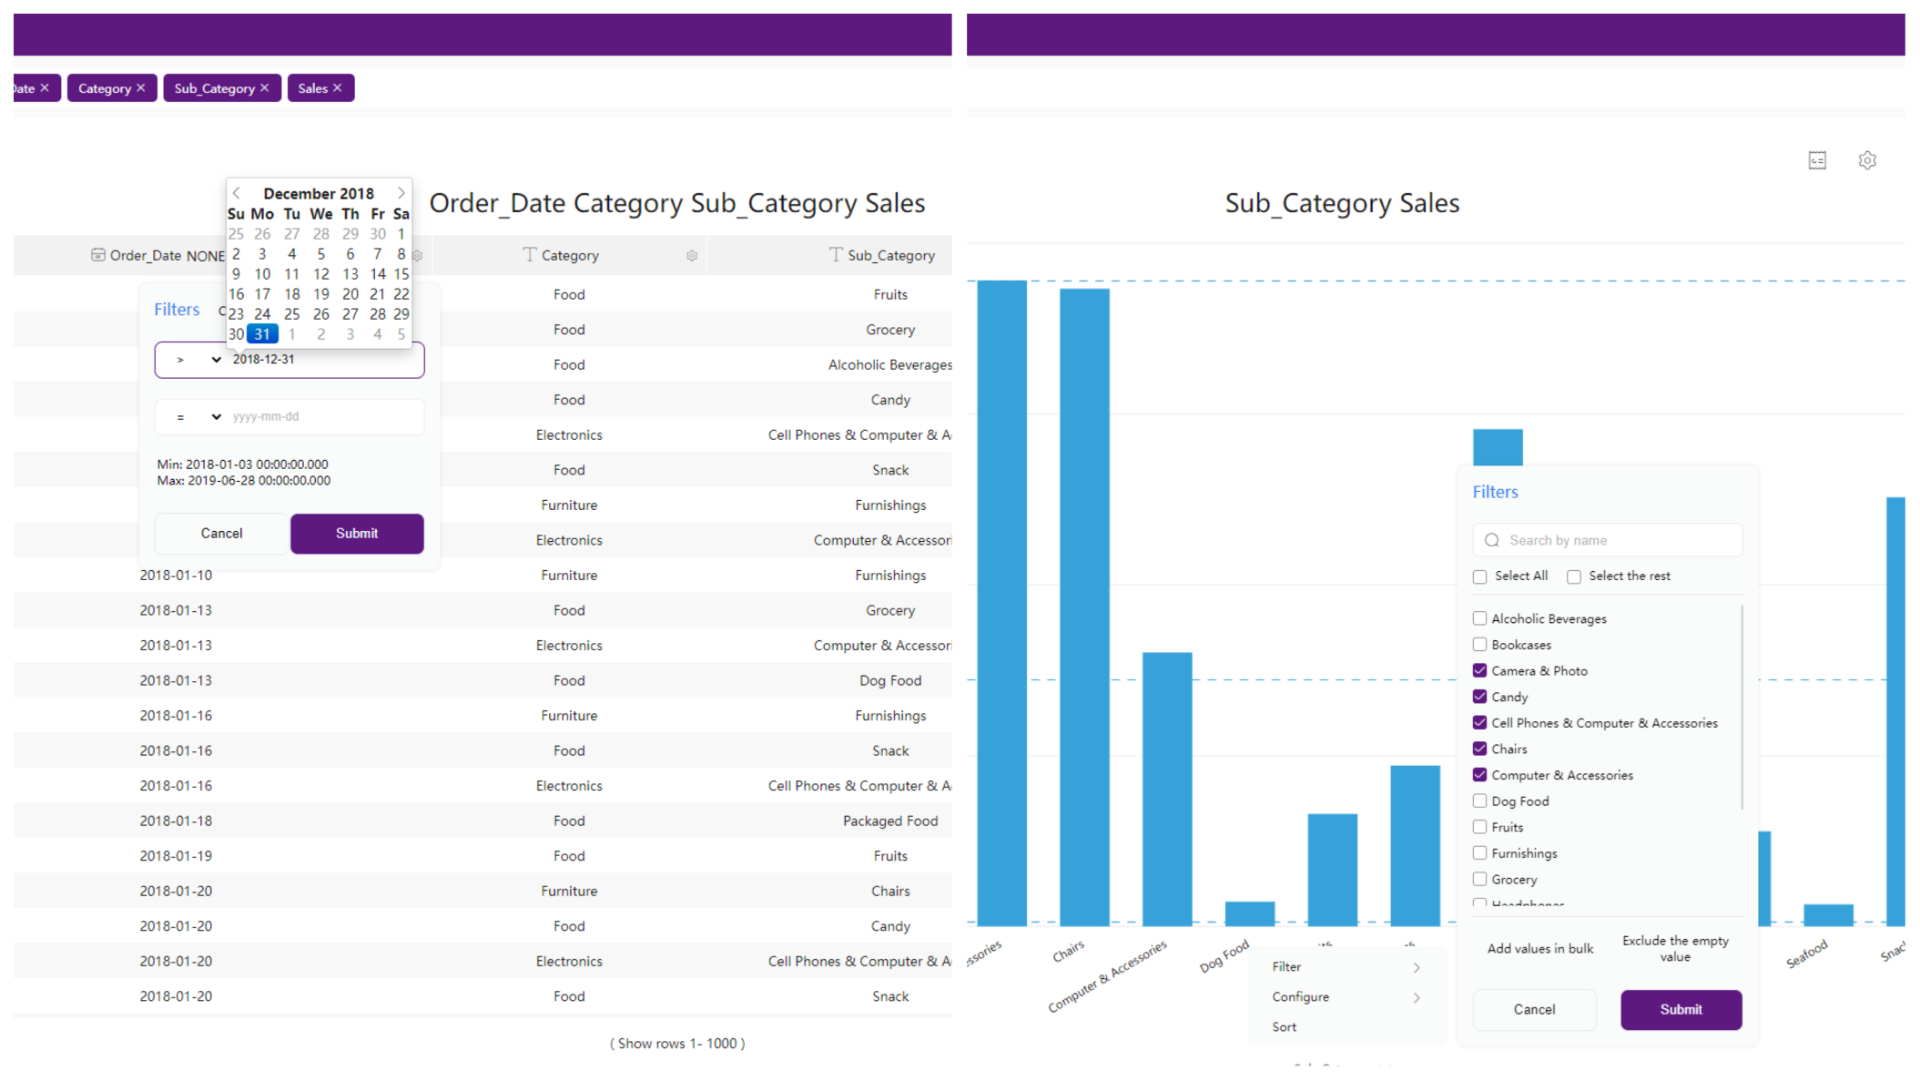
Figure 2-30 Filter on charts -
Selection
For some charts such as bar charts, if you select some parts of the chart, then the chart would focus on the part selected.
GIF Figure 2-31 Selection
-
-
Dashboards
-
Filter Components
Similar to filter controls, filter components can be put into a dashboard, and users can interact with them. Also, there are different filter components you can select from.
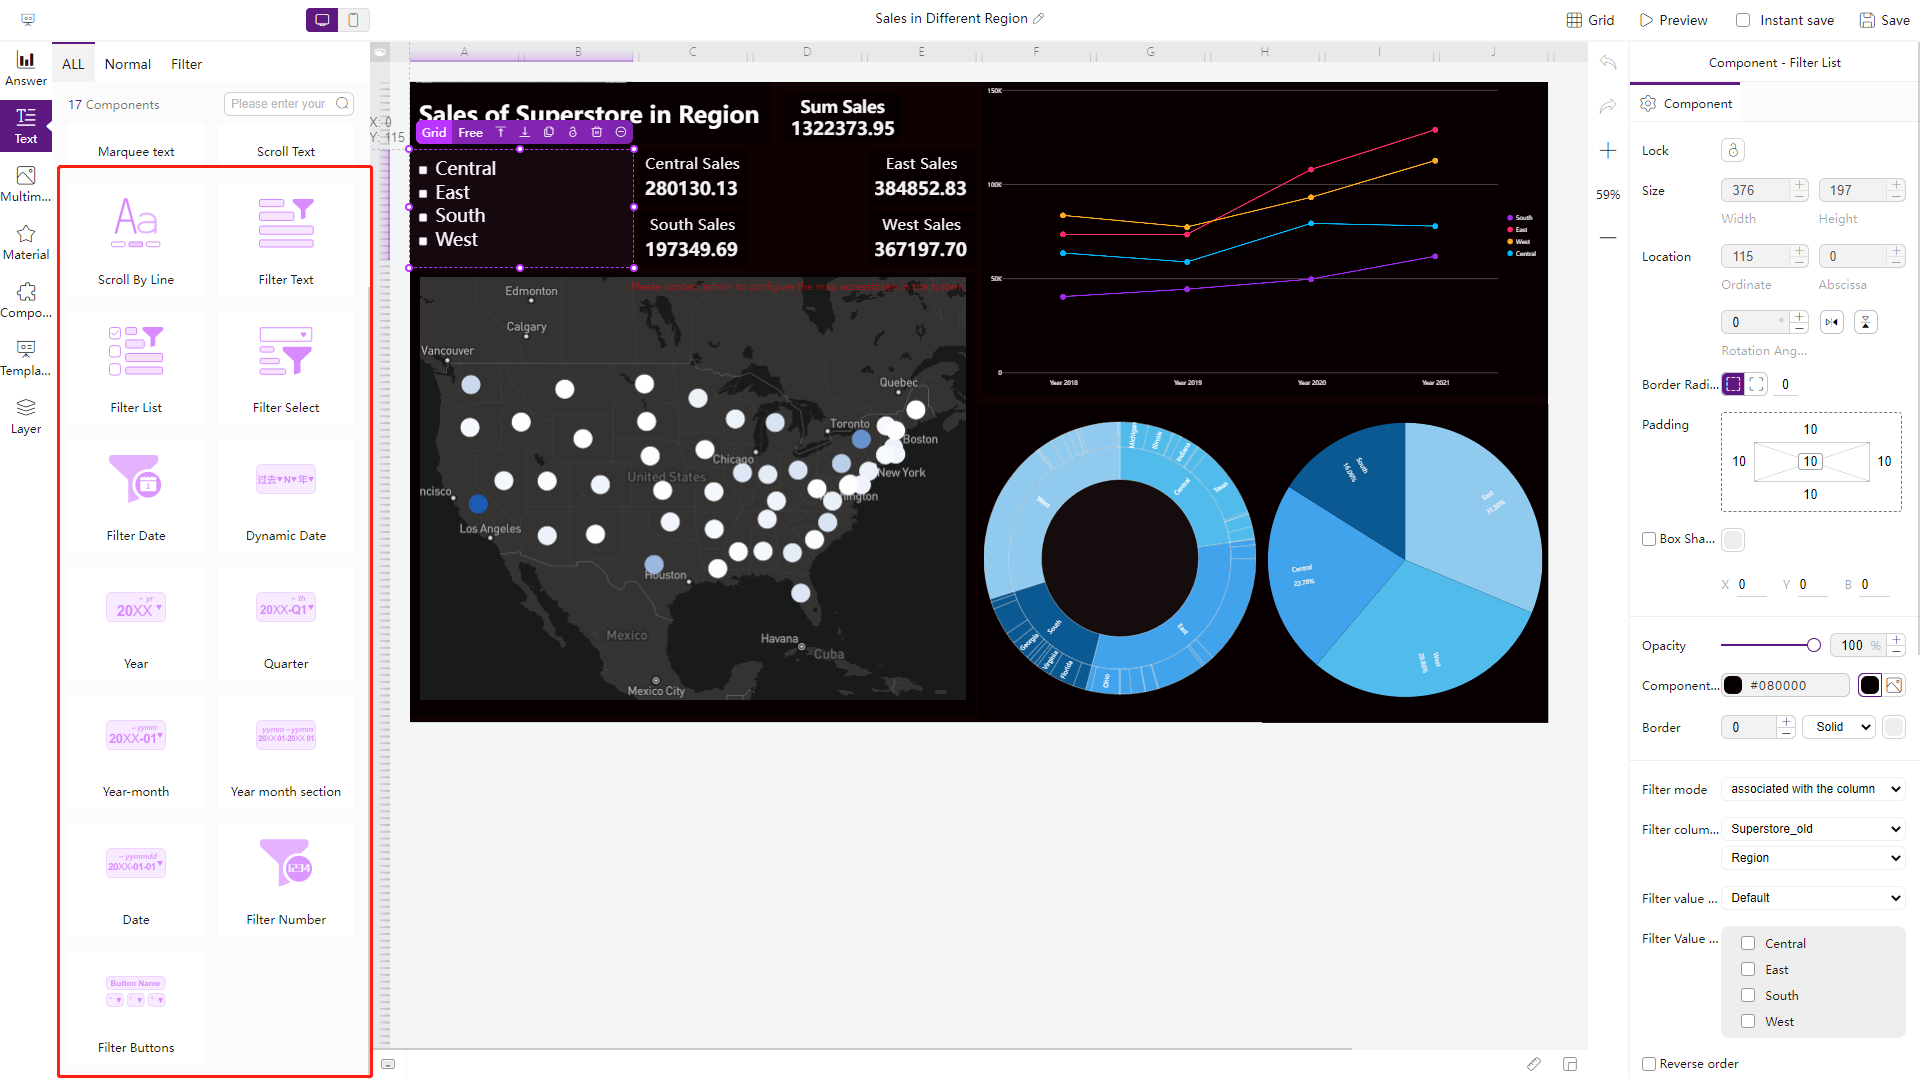
Figure 2-32 Filter components -
Filter Interactions
Users can interact with the dashboard by clicking a data point, and related charts in the dashboard would be filtered together or by selecting a certain area of data to view the details.
GIF Figure 2-33 Filter interactions -
Filter Conditions
When viewing the dashboard, you can add different conditions to filter all relevant charts.
GIF Figure 2-34 Filter conditions
-
-
2.3.3 Formula Editor
| Aspects | Amazon QuickSight | DataFocus Cloud |
|---|---|---|
| Formula Types | Aggregate, conditional, date, numeric, string, table related | Aggregation, analysis, transfer, date, numeric, text, operators, JSON… |
| Prompt | After typing | Before and after typing |
| Examples/Syntax | Column types | Example column names from tables |
| Validation | Error prompt | Automatically |
| More | Learn more | Advanced settings |
-
Formula types
The two platforms both support various formulas for users to apply. Amazon QuickSight also displays the “All” category to show all formulas, while DFC supports some formulas related to JSON files.
-
Prompt
When implementing formulas in Amazon QuickSight, the system would prompt all possible functions, fields, etc. after typing, as shown below. Also, the system would also return the syntax after selecting one value.
GIF Figure 2-35 Prompt - Amazon QuickSight DFC’s system would prompt both syntax, and function as well as column names before and after typing.
GIF Figure 2-36 Prompt - DFC -
Examples
Both tools display descriptions and examples of formulas. While Amazon QuickSight displays the column types, DFC displays specific examples such as column names from the data tables.
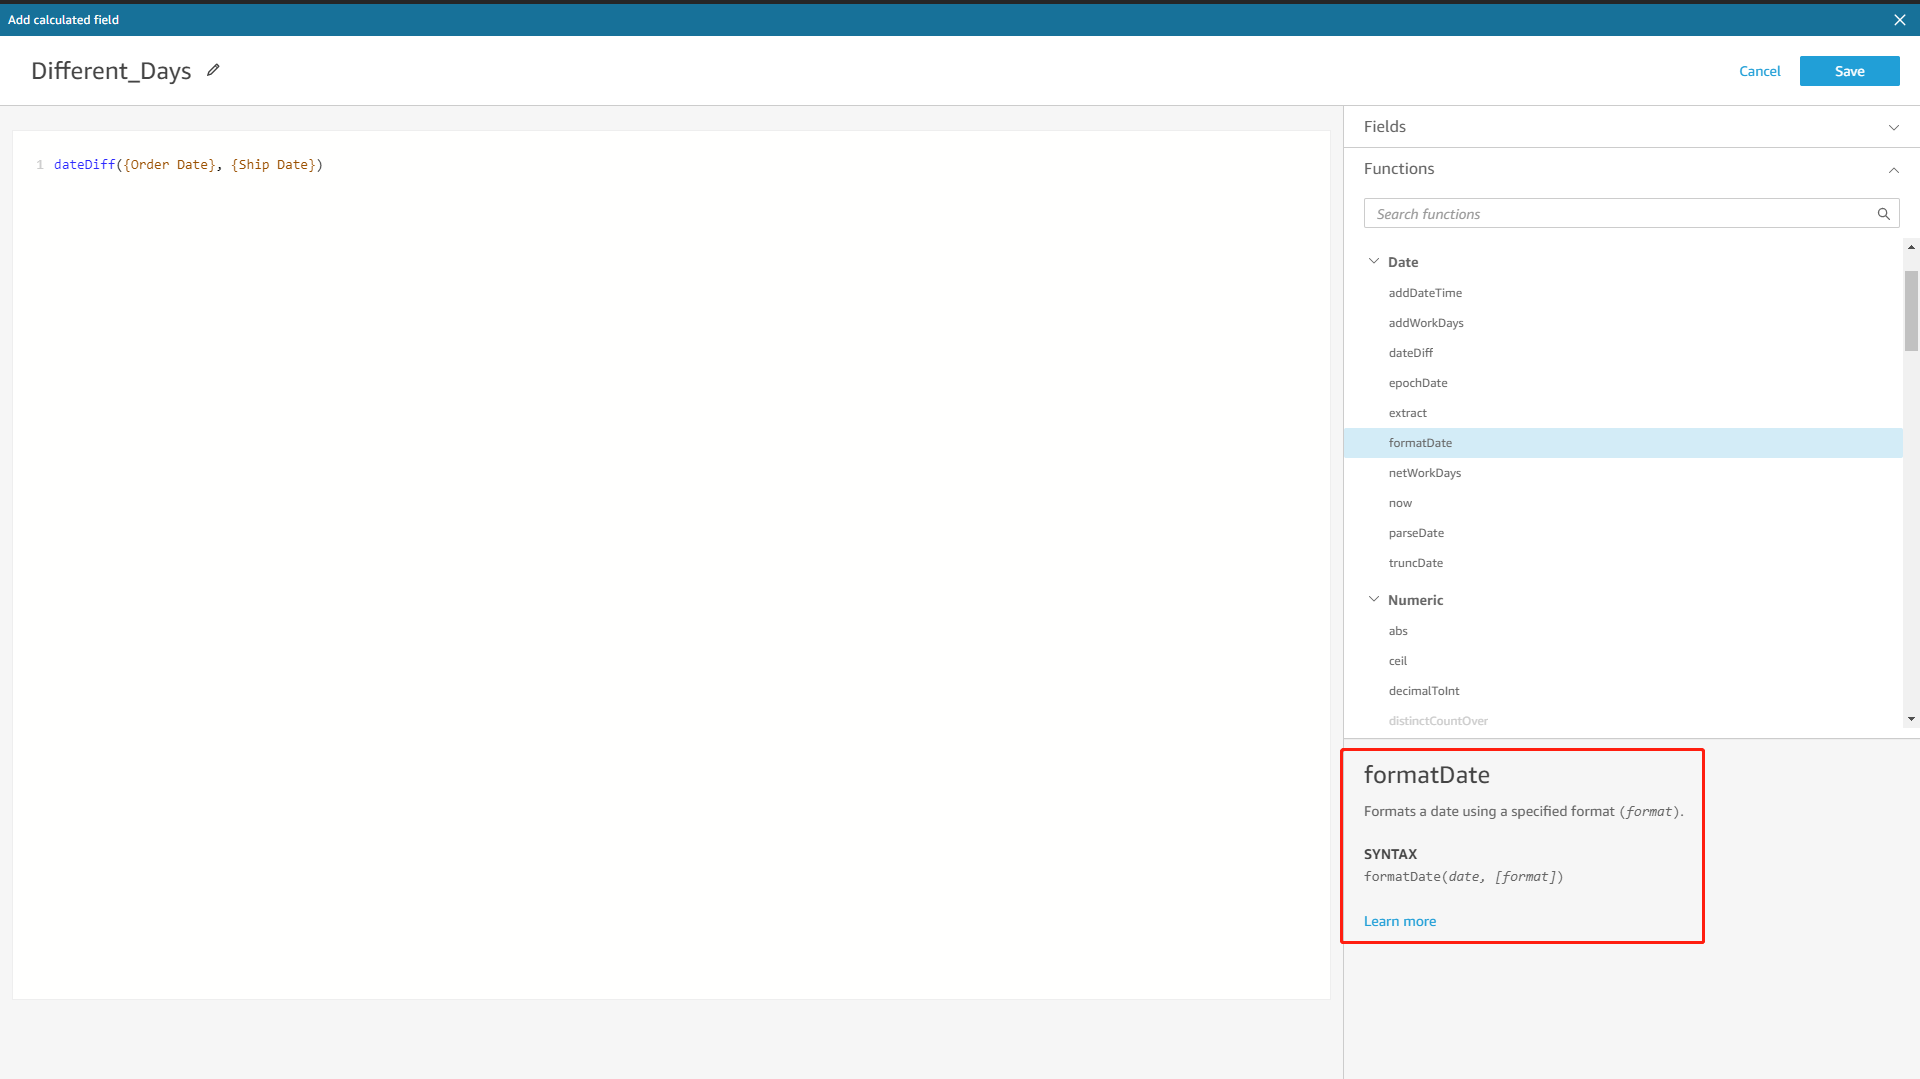
Figure 2-37 Formula examples - Amazon QuickSight 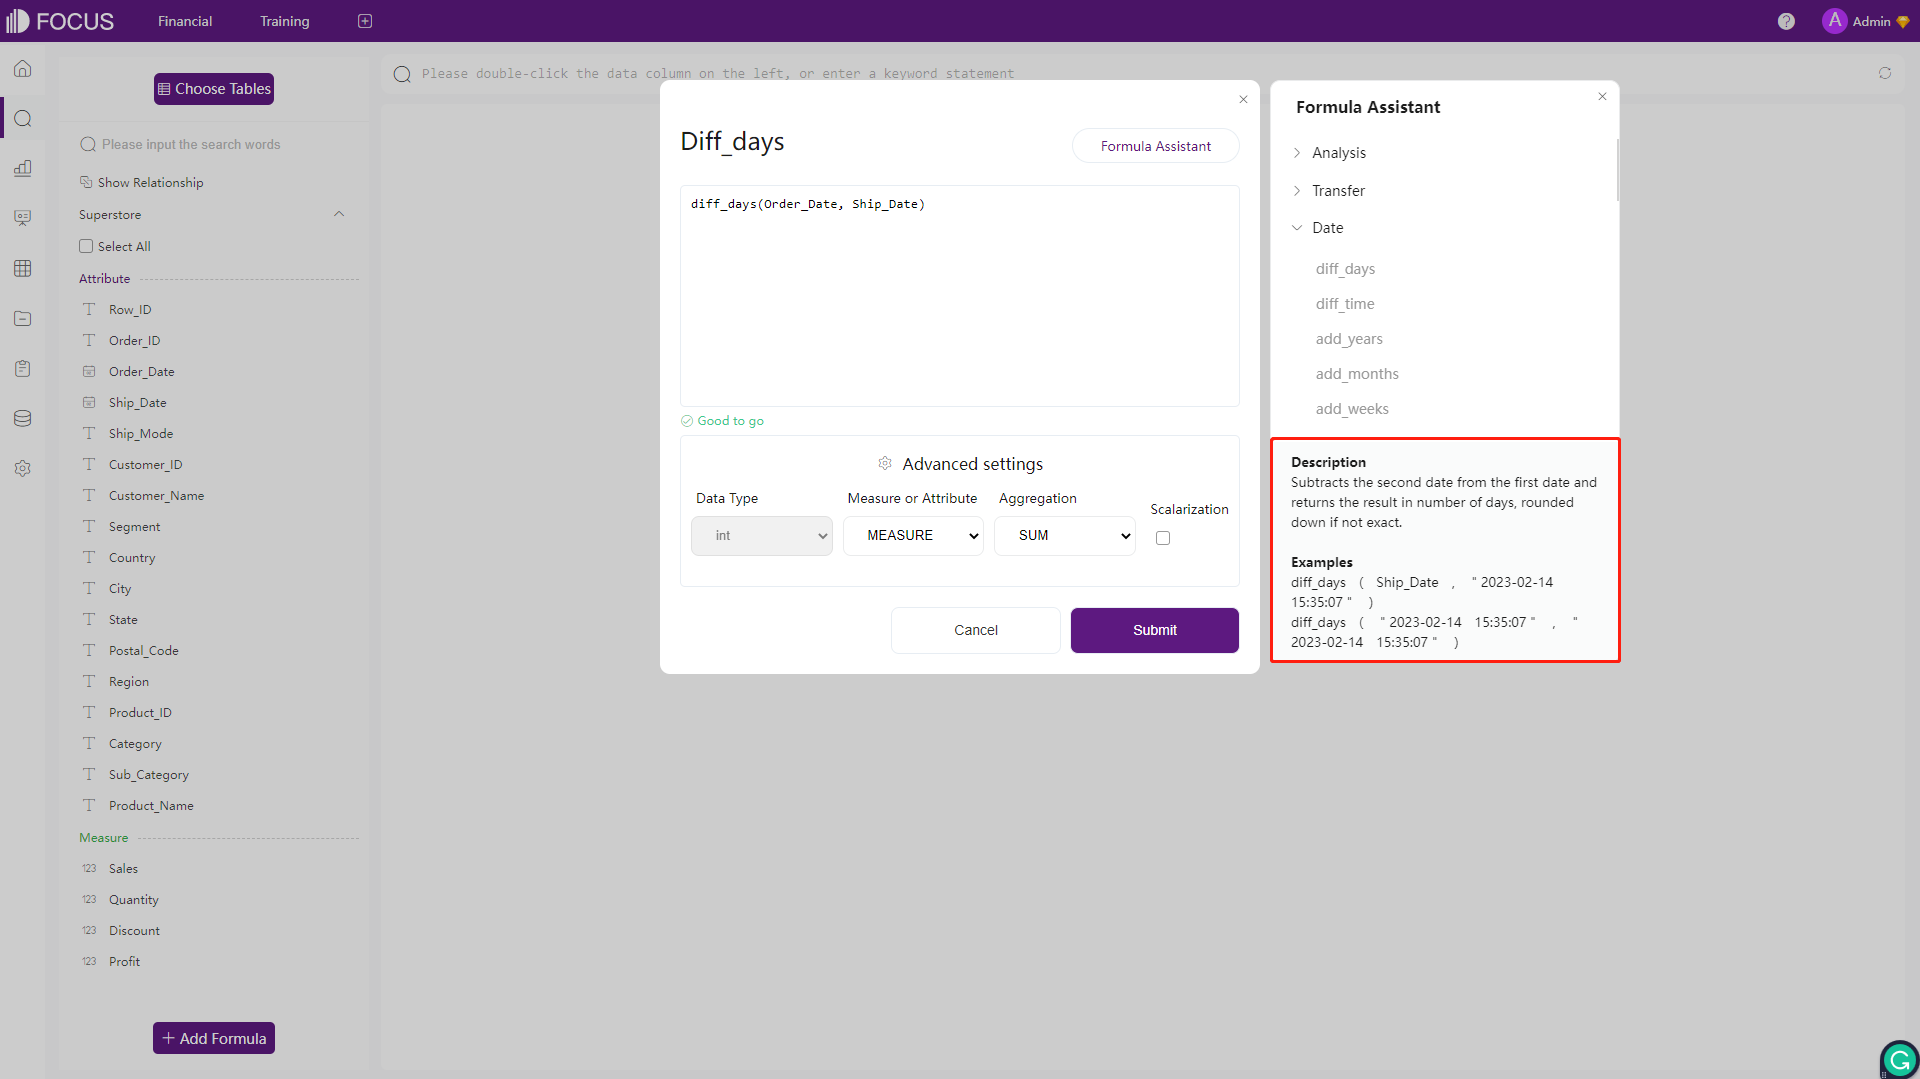
Figure 2-38 Formula examples - DFC -
Validation
Formulas in Amazon QuickSight would be validated once clicking the “Save” button, and an error message would appear if there are some errors in the formula. On the other hand, formulas in DFC would be validated in real-time and automatically. Once there is an error detected, the system would immediately return the error message.
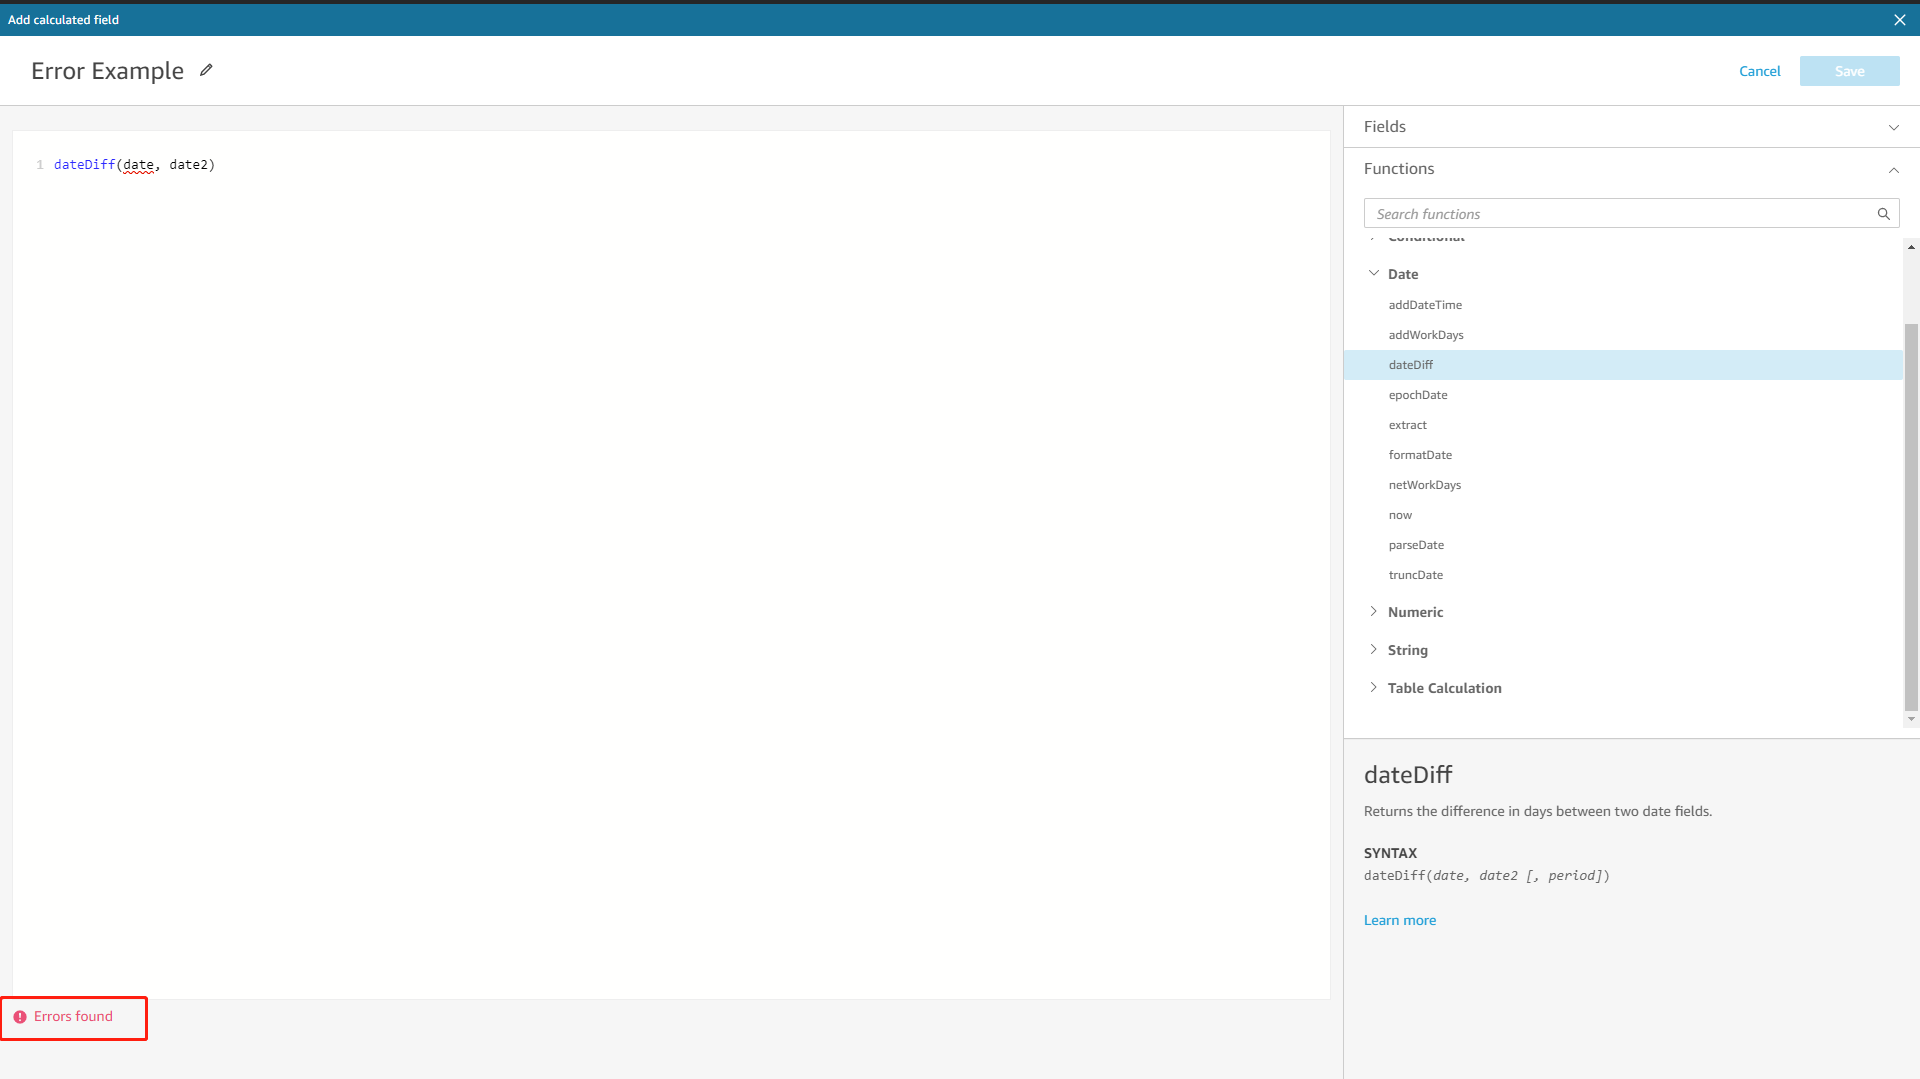
Figure 2-39 Validation - Amazon QuickSight 
GIF Figure 2-40 Validation - DFC -
More
There are other features in the formula editor. For Amazon QuickSight, users can click the “Learn more” button to get more information about the formula. For DFC, users can set the result as a measure or an attribute, select aggregation, and choose whether to scalarize the result. (Scalarization means to make the aggregated result a constant for further calculation)
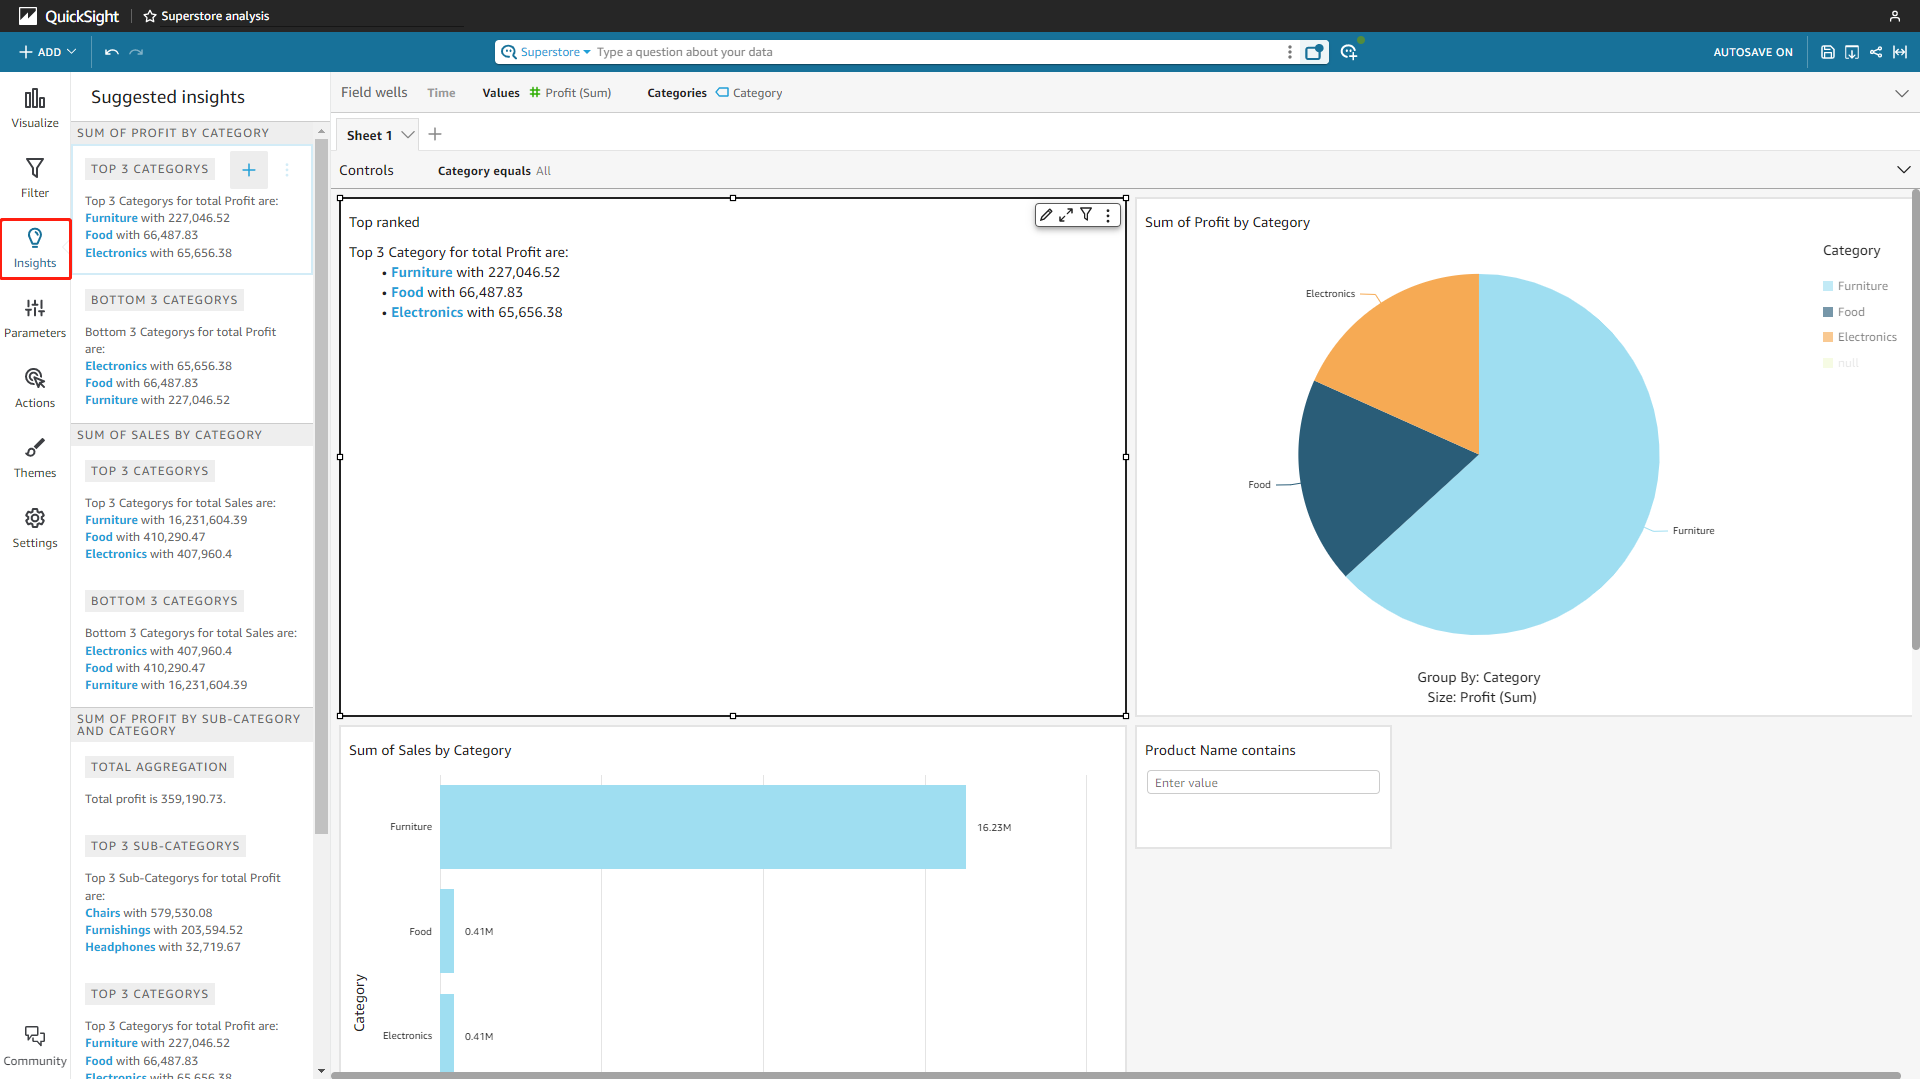
2.3.4 Insights
Both platforms provide an “Insights” feature, but they are quite different.
In Amazon QuickSight, the insights are computed analysis ready to use. The system would list various suggested insights from the data, and users can add these insights to the analyses.
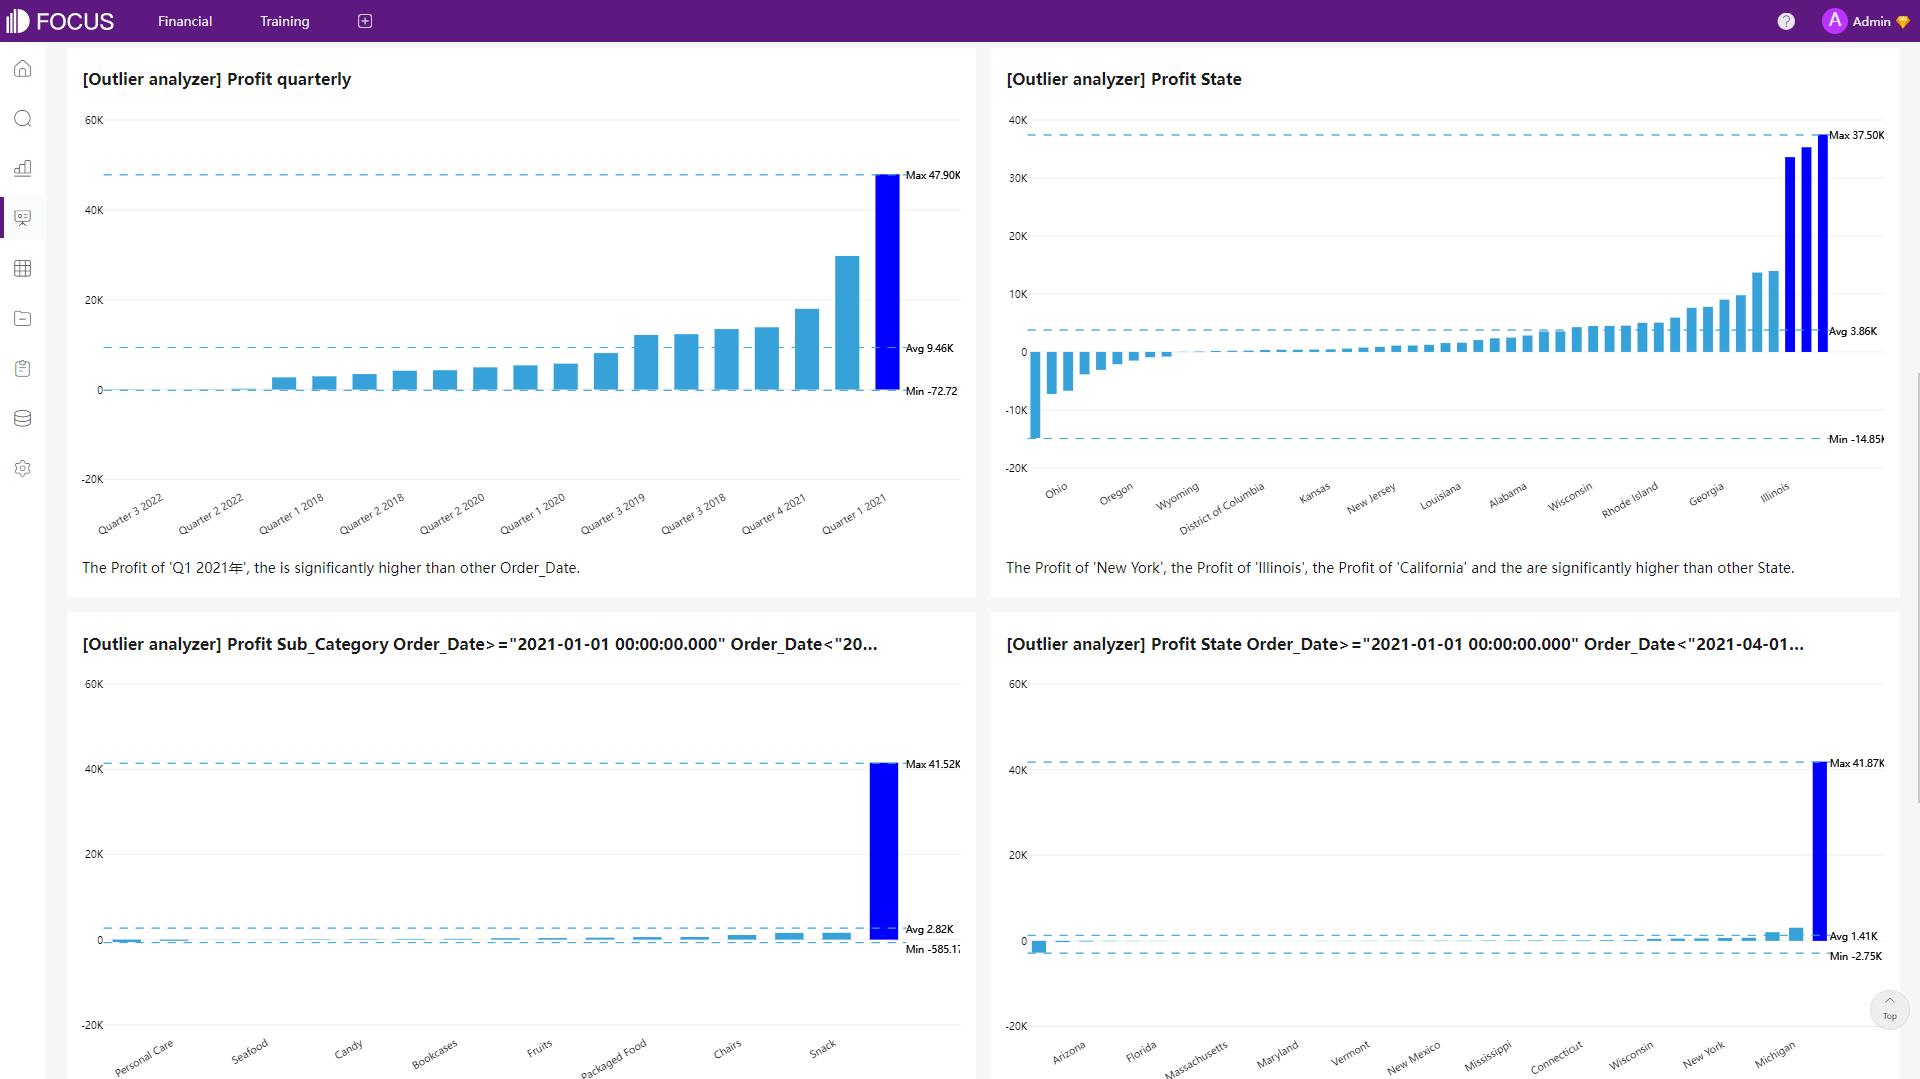
In DataFocus Cloud, the insights feature allows some statistical analysis of the data table, which includes outlier, correlation, and trend analysis currently. Below is an example of the outlier analysis.
2.4 Data Processing
Processing data is very important for data analysis, some potential processes such as data addition, table join, conversion between rows and columns, and column split are compared here.
-
Add Data
-
Amazon QuickSight
Users can either update the original file or add additional data. To update the file, the new file needs the same fields in the same order as the original file. When adding data, users can choose data from the dataset, data source, or local file.
-
DataFocus Cloud
Users can update the table by uploading a local file, additional rows can be added to the original table by using the “Cumulative” feature, and the entire table can be replaced using the “Overlay” feature. Note that the columns should be the same.
-
-
Join Tables
Both tools offer four kinds of join types and one table can have multiple joins. For Amazon QuickSight, users can join tables from datasets, data sources, or local files. For DFC, users can join tables that come from different sources, as long as the tables are in the system. Furthermore, filters can be added while joining tables in DFC.
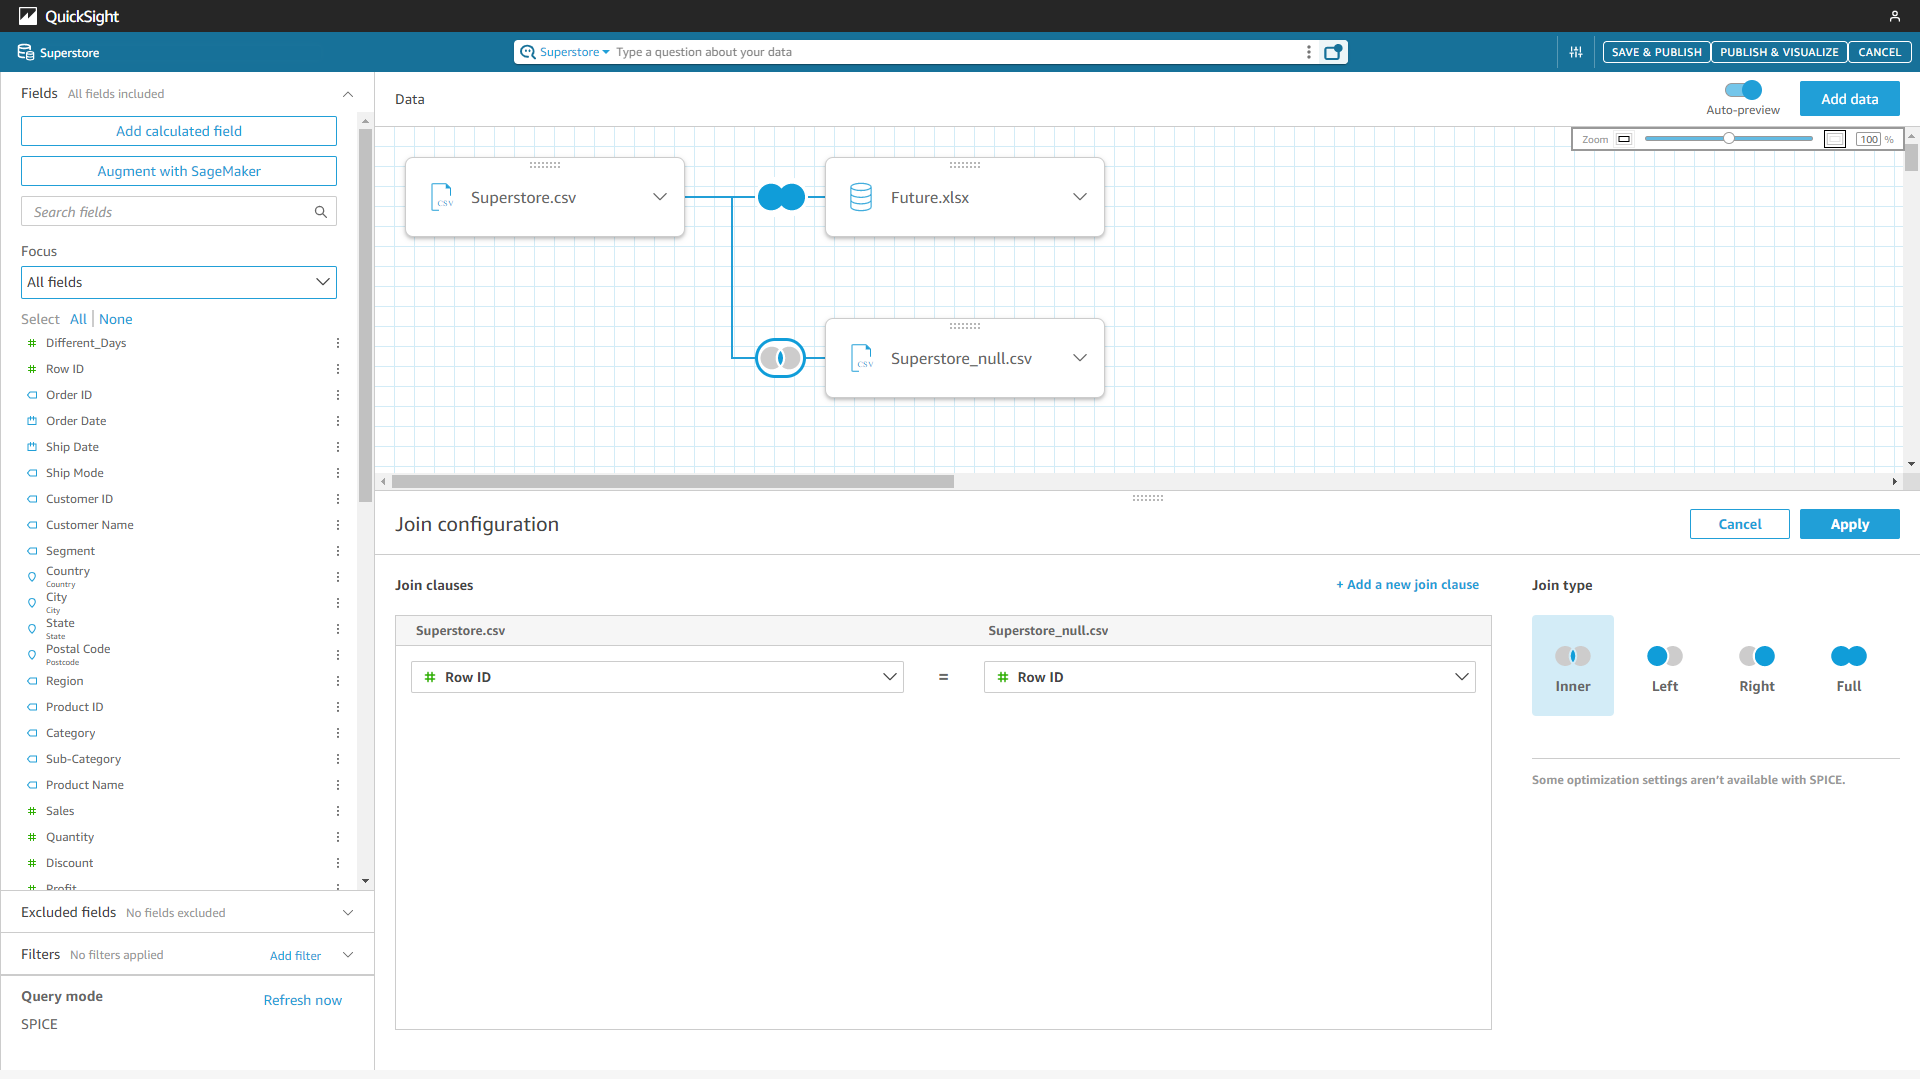
Figure 2-43 Join tables - Amazon QuickSight 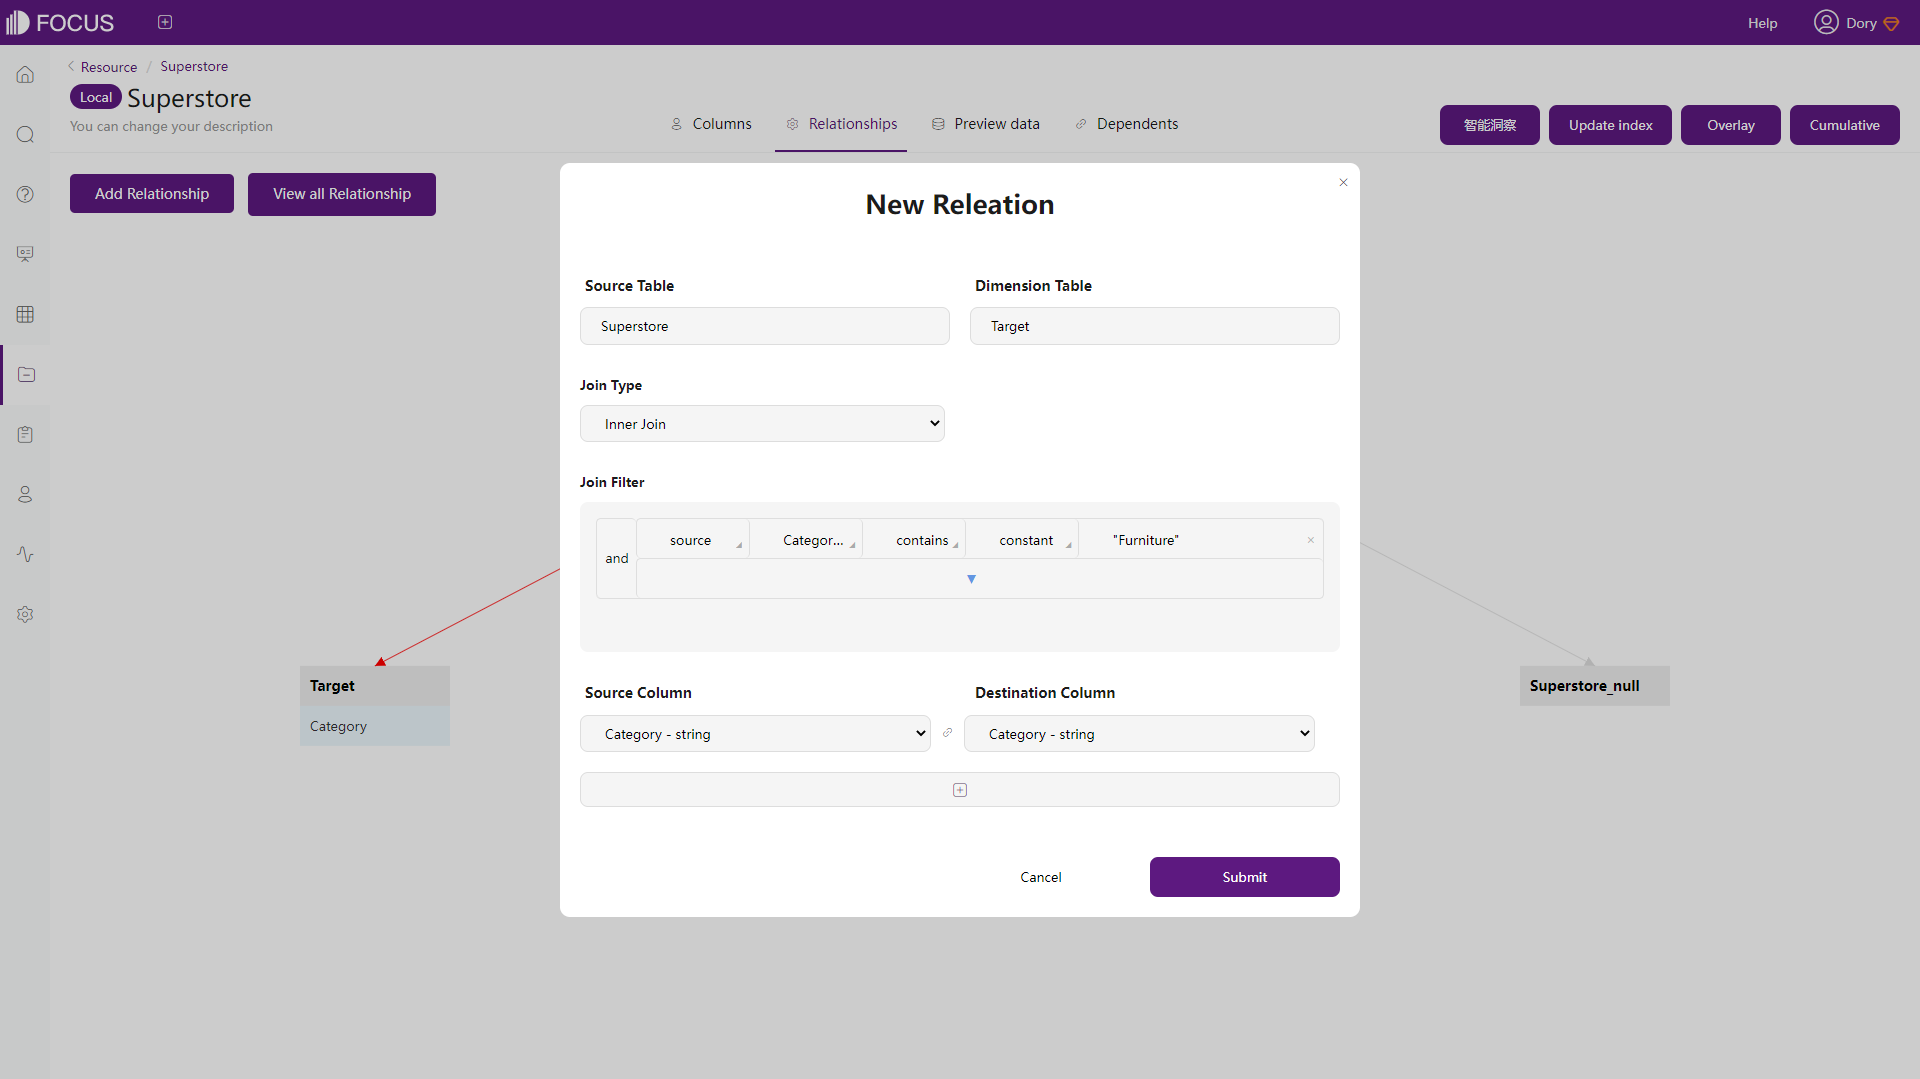
Figure 2-44 Join tables - DFC -
Convert Rows&Columns
-
Amazon QuickSight
To convert between rows and columns, users need to use SQL commands “PIVOT” and “UNPIVOT” in Amazon QuickSight, as shown below.
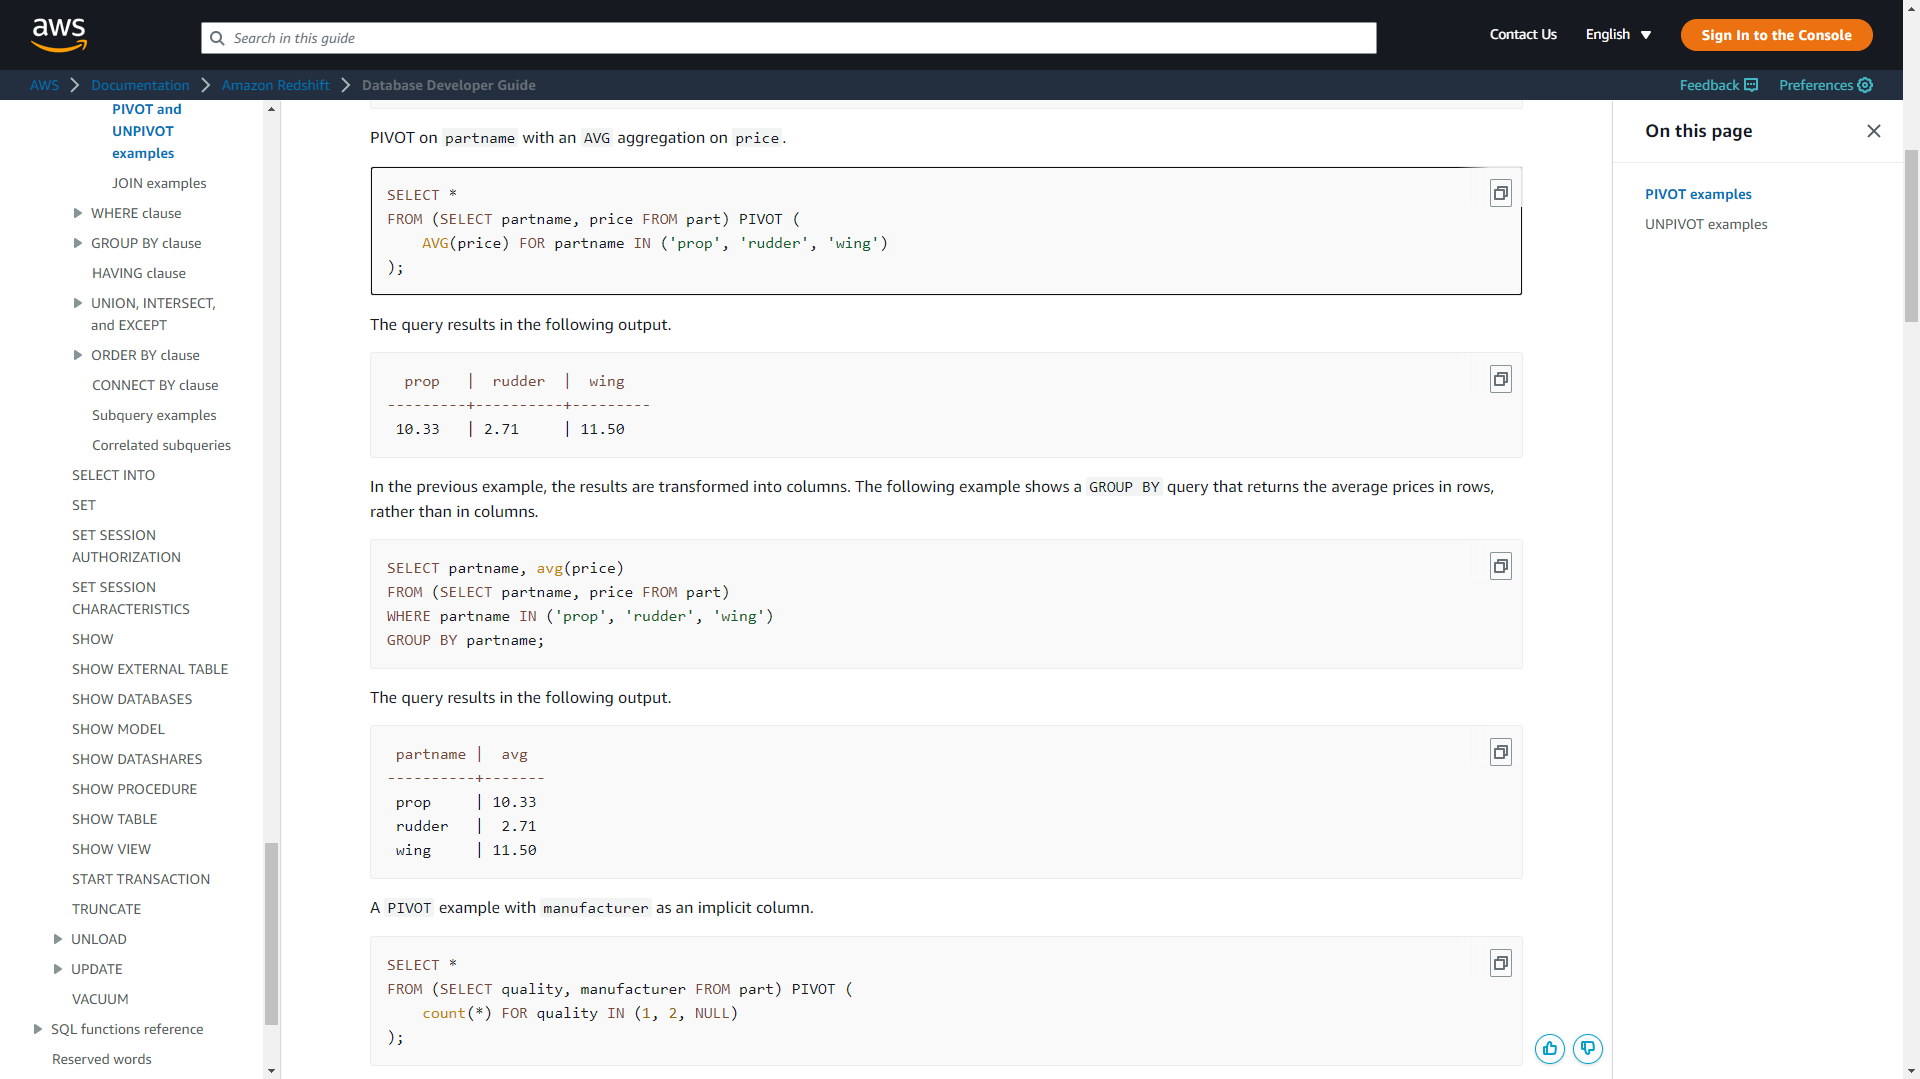
Figure 2-45 Pivot - Amazon QuickSight -
DataFocus Cloud
DataFocus Cloud is a code-free system, and thus users do not need to implement SQL statements. As shown below, rows and columns can be converted with simple operations.
GIF Figure 2-46 Convert rows&columns - DFC
-
-
Split Columns
-
Amazon QuickSight
To split columns, users may use the formula “Split”. Here is an example of splitting a column.
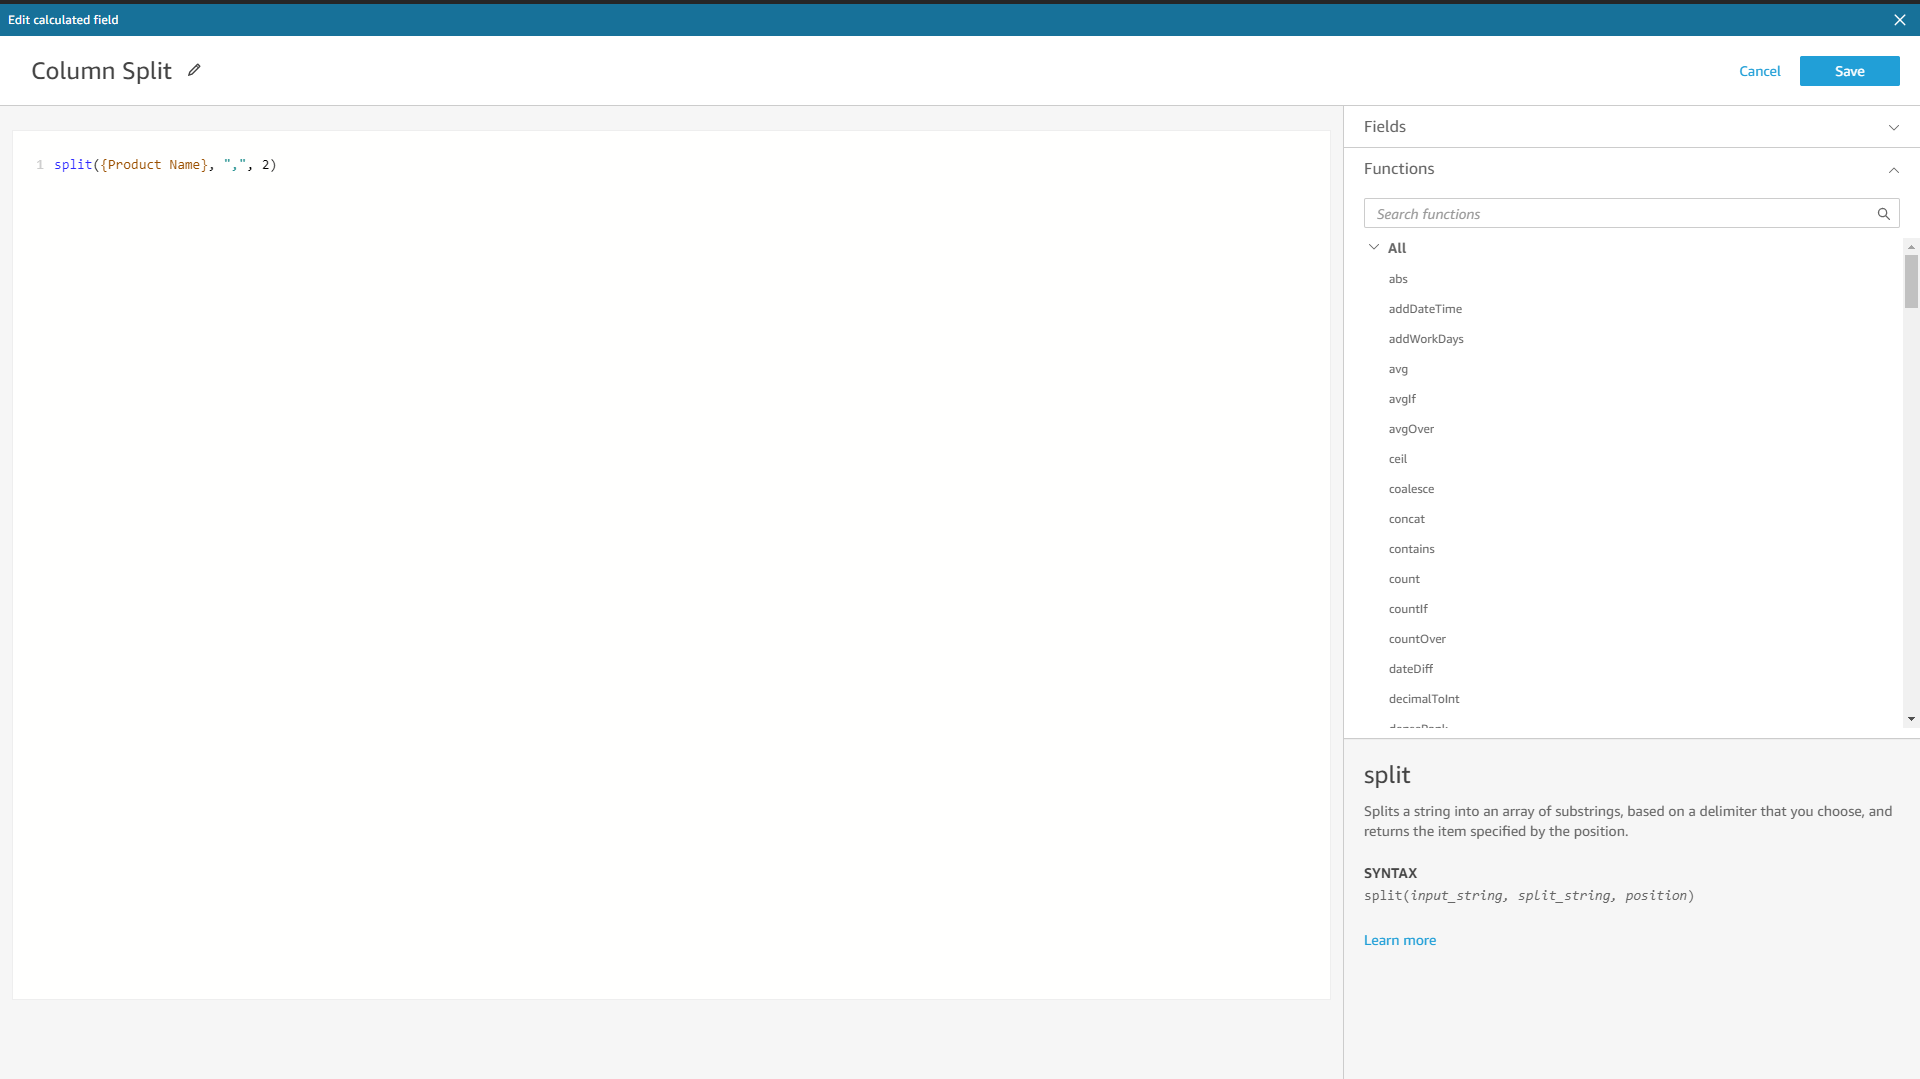
Figure 2-47 Split columns- Amazon QuickSight -
DataFocus Cloud
When splitting columns, users can select the split number and choose multiple delimiters in DFC, as shown below.
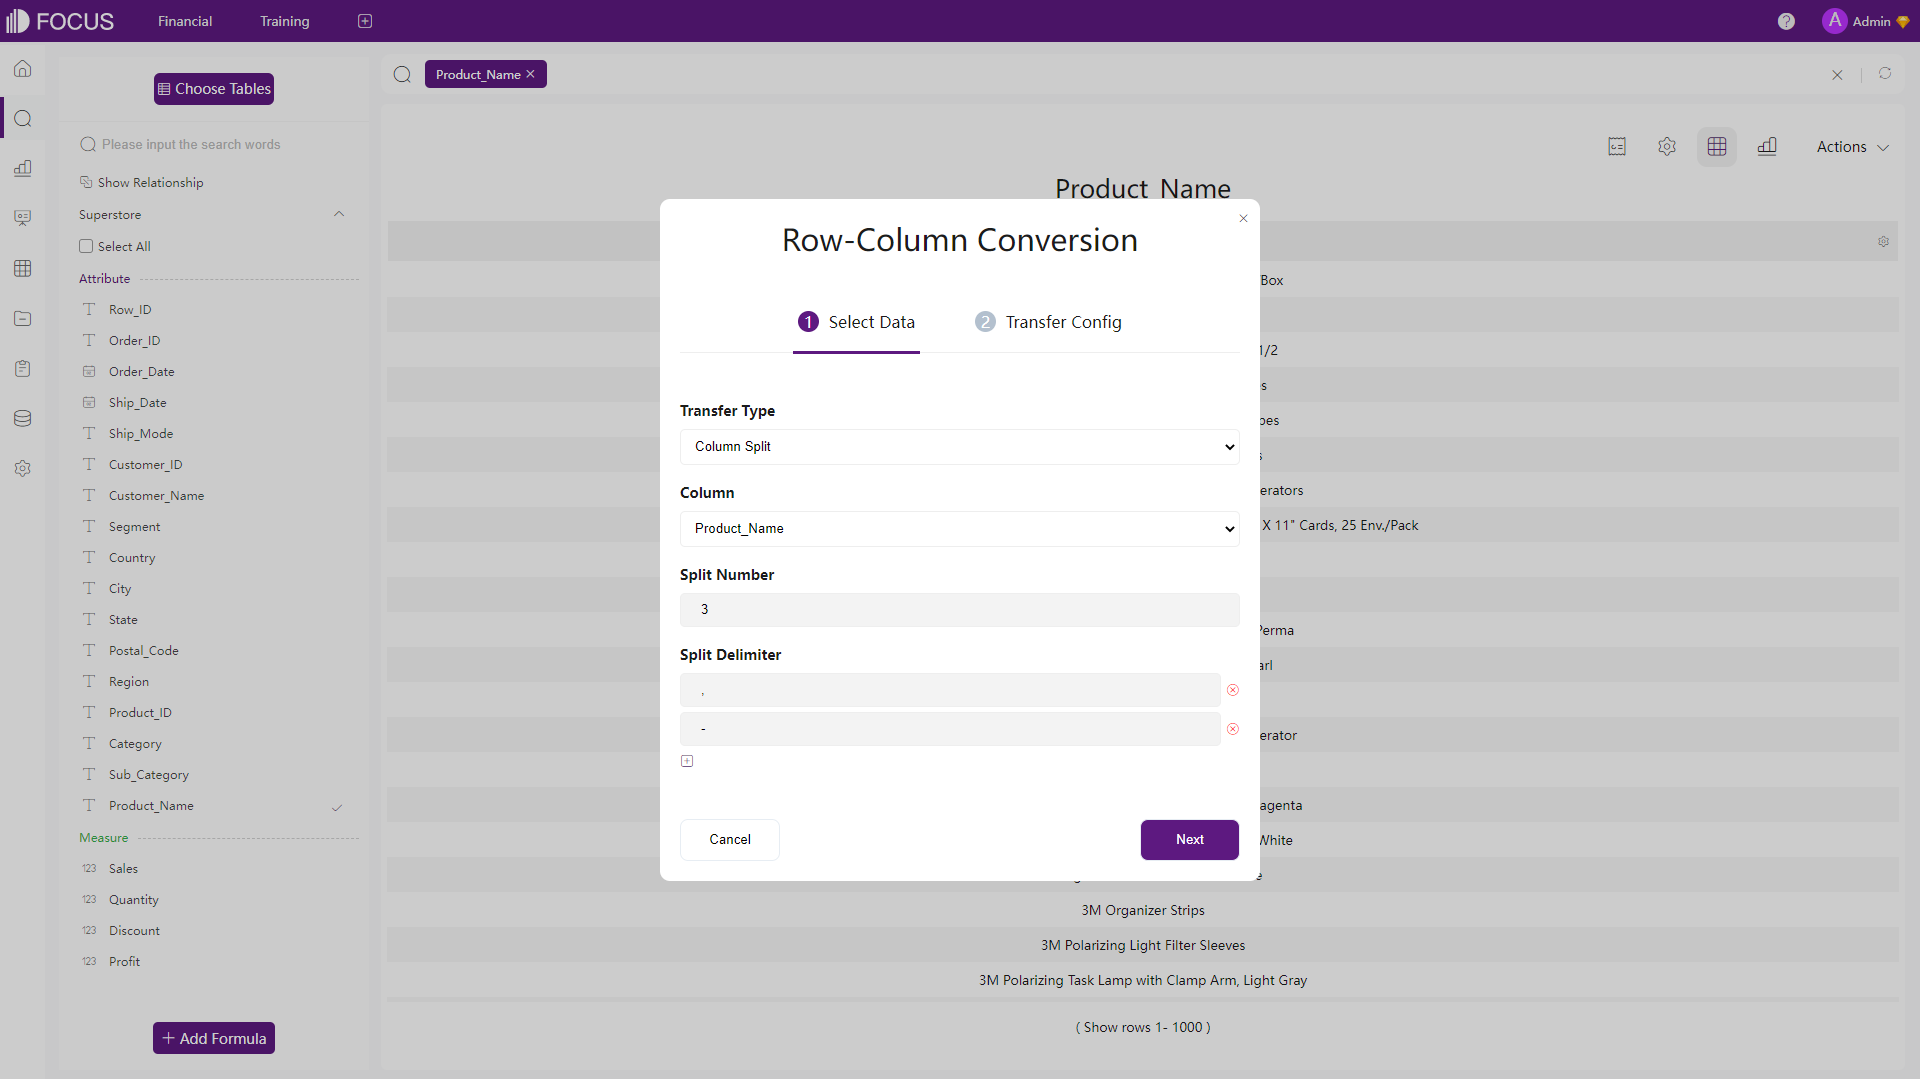
Figure 2-48 Split columns - DFC
-
Except for the data processing mentioned above, the incoming DataSpring of DFC can support many more data processing features.
2.5 Visualizations
2.5.1 Charts
Amazon QuickSight offers around 30 visual types and DataFocus Cloud offers more than 50 chart types. For each kind of chart, there are also many configurations. With a high level of customization, DFC provides different features for users to design their own charts, such as adding data labels, setting the carousel, etc. Here, five kinds of chart types are compared.
-
Tables
Both platforms support table and pivot table, and DFC additionally supports the cross table.
-
Table & Grid Table
Data are presented as simple rows and columns. The two tools both offer to edit the title, headers, total row, etc., and the grid table of DFC also supports setting the heatmap mode, adding indexes, etc.
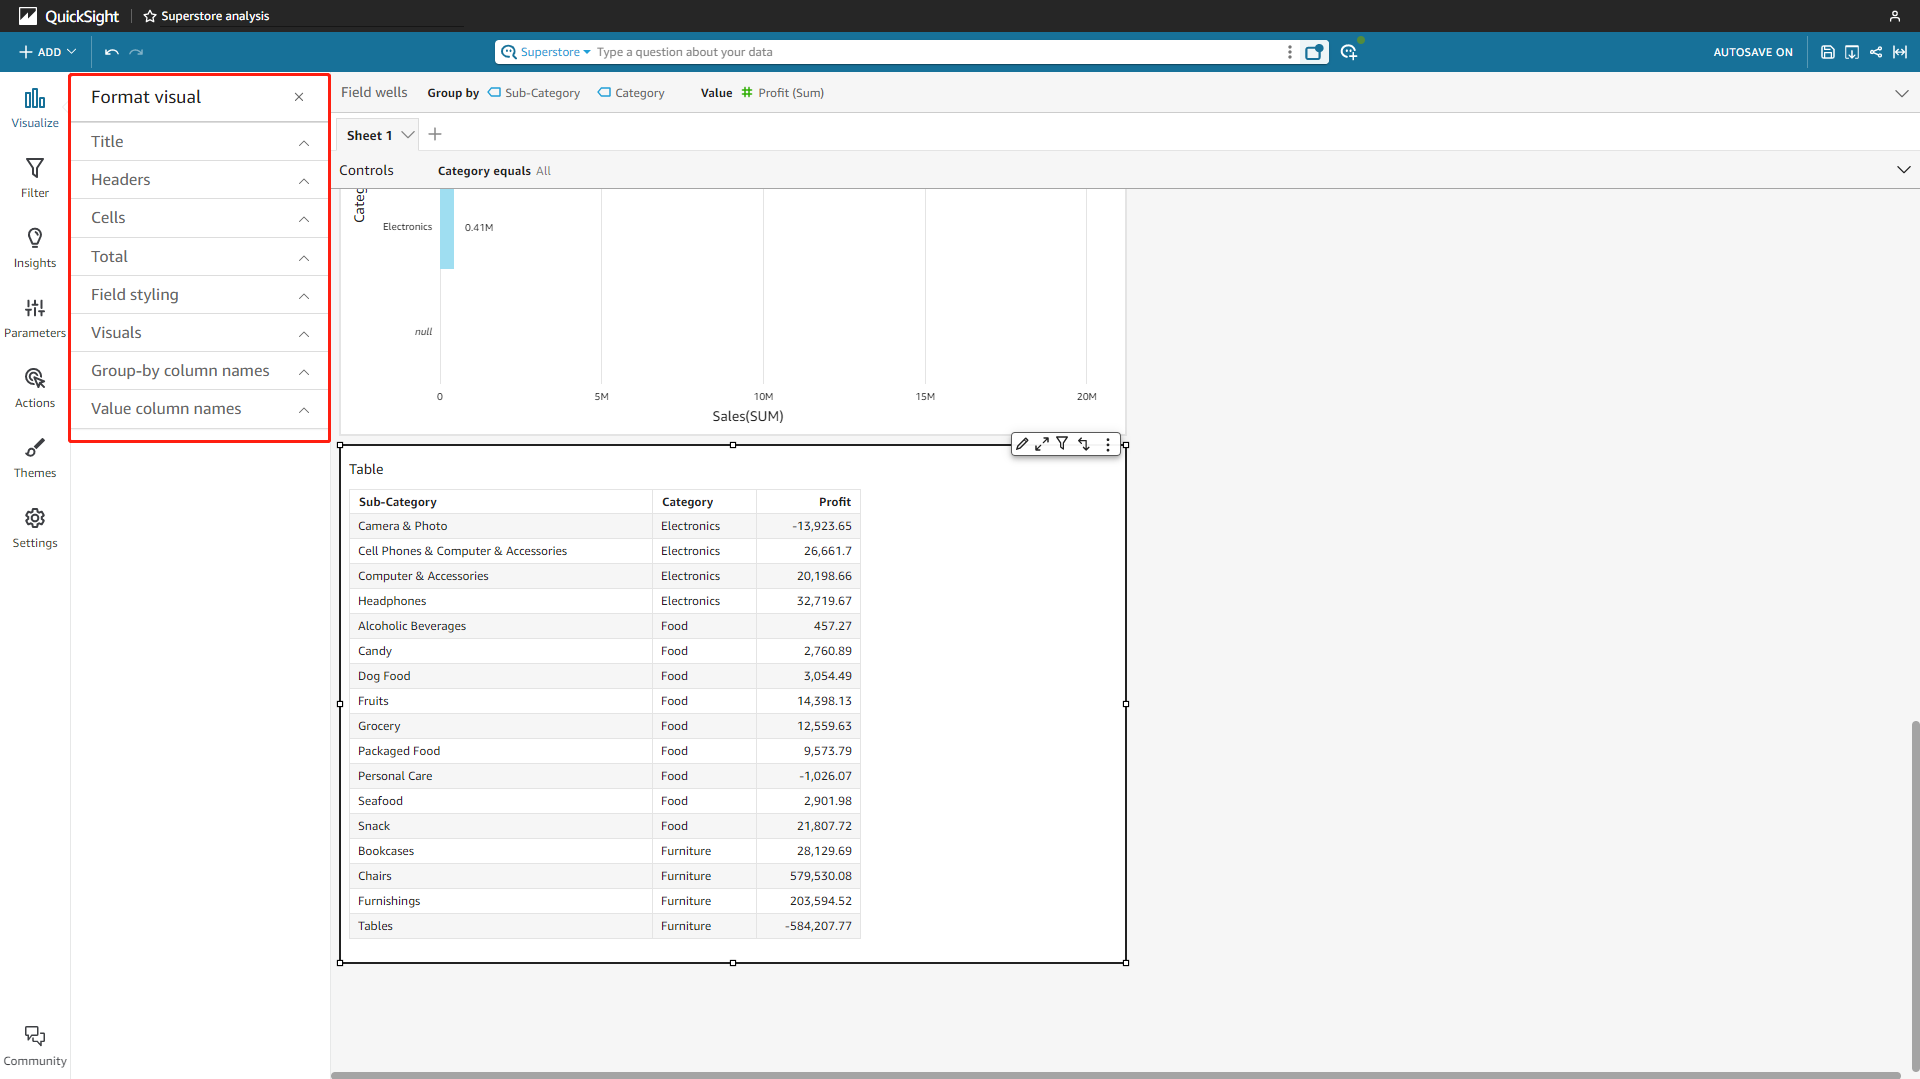
Figure 2-49 Table - Amazon QuickSight 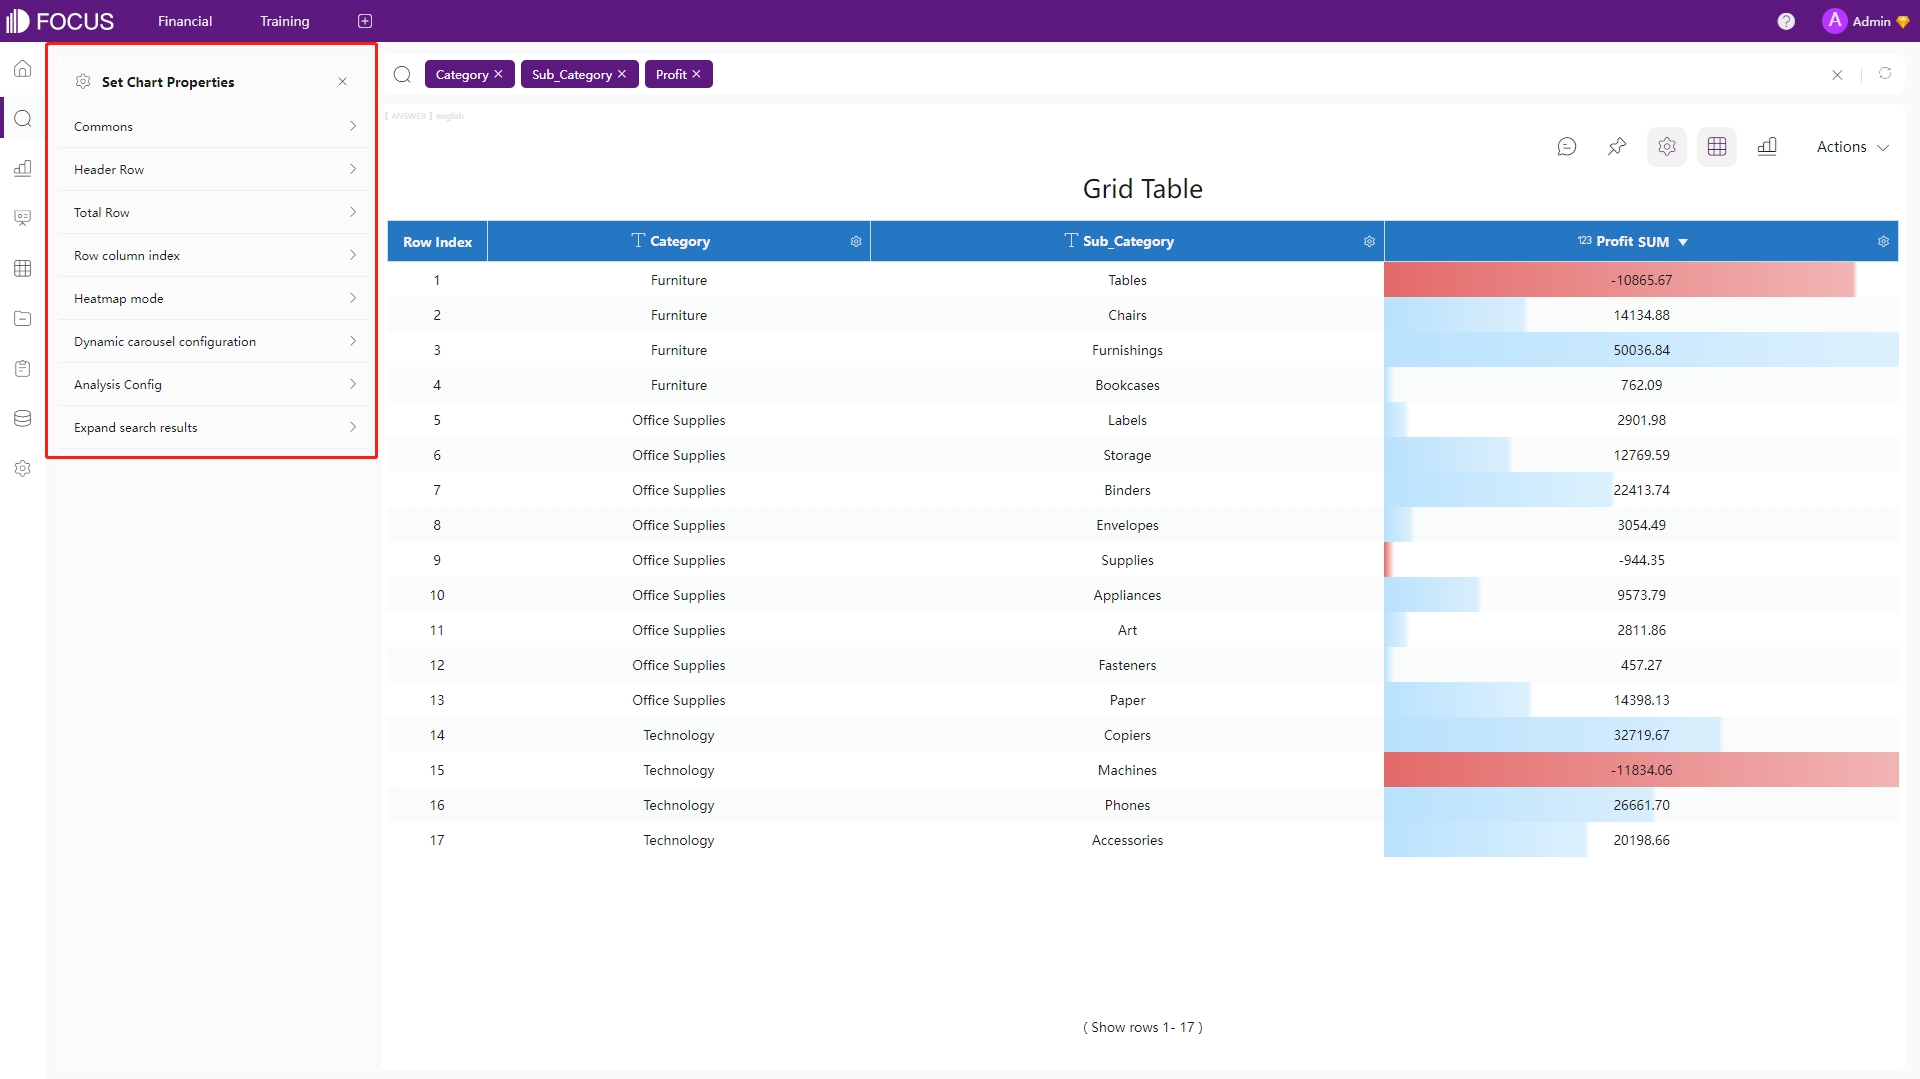
Figure 2-50 Grid table - DFC -
Pivot Table
Pivot tables can be used to summarize large datasets. The configurations are basically the same as tables, but users can also add subtotal.
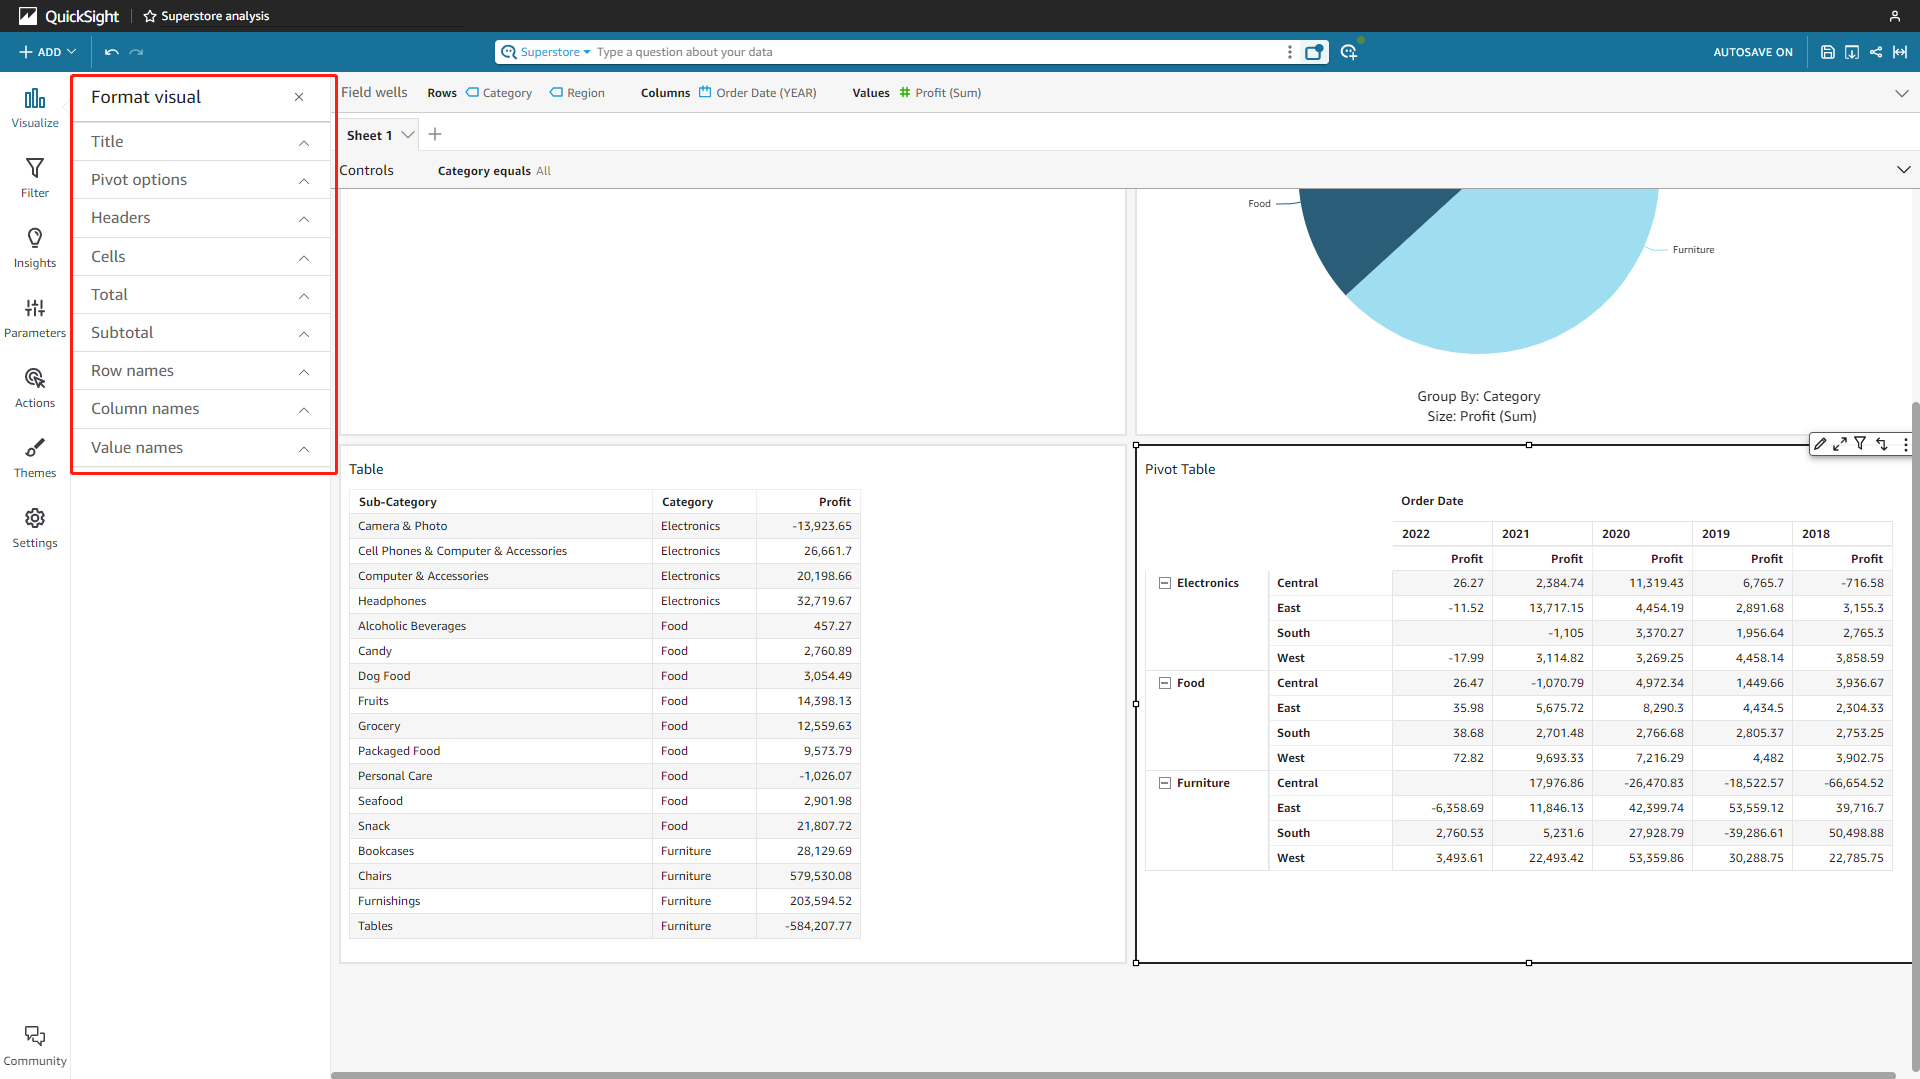
Figure 2-51 Pivot table - Amazon QuickSight 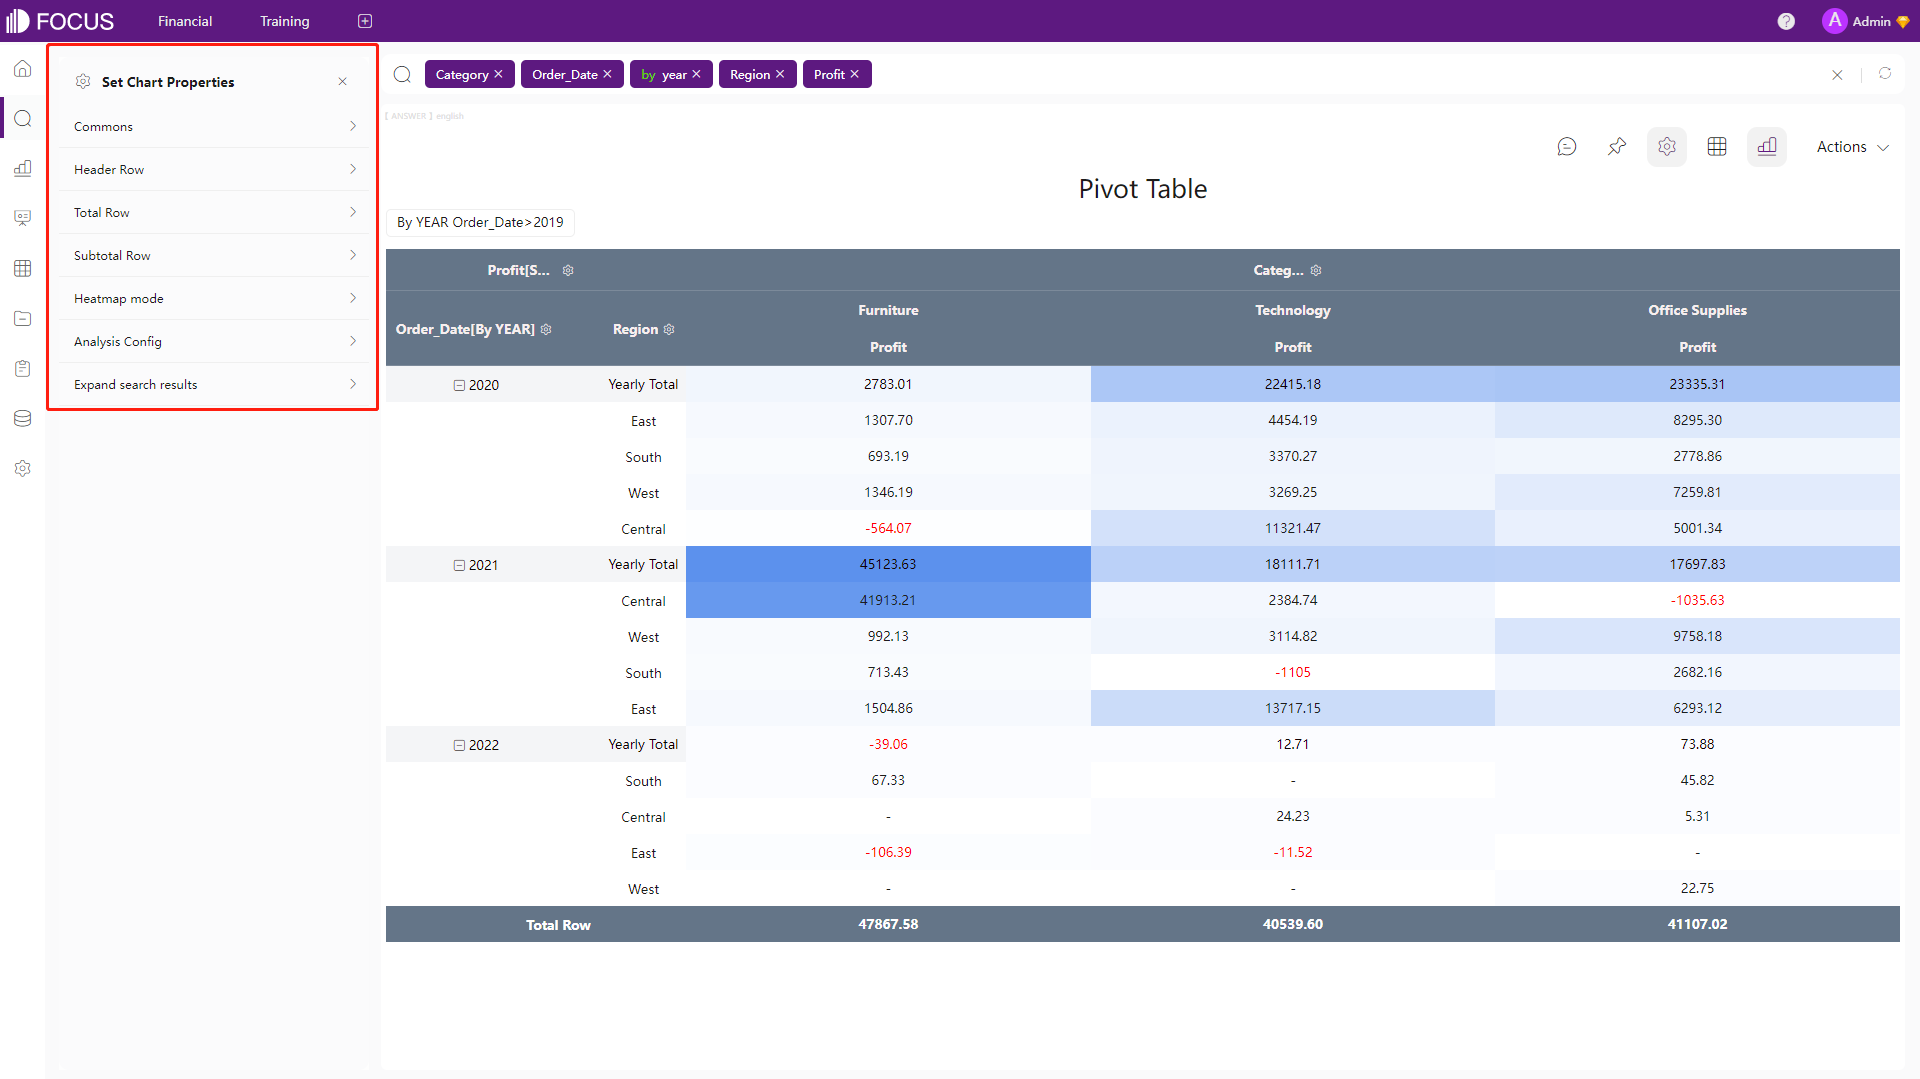
Figure 2-52 Pivot table - DFC -
Cross Table
Cross tables can summarize data with multiple dimensions, which can fit complicated business scenes. Except for configuring headers and totals, users can also pin columns and rows to view certain data when moving the table.
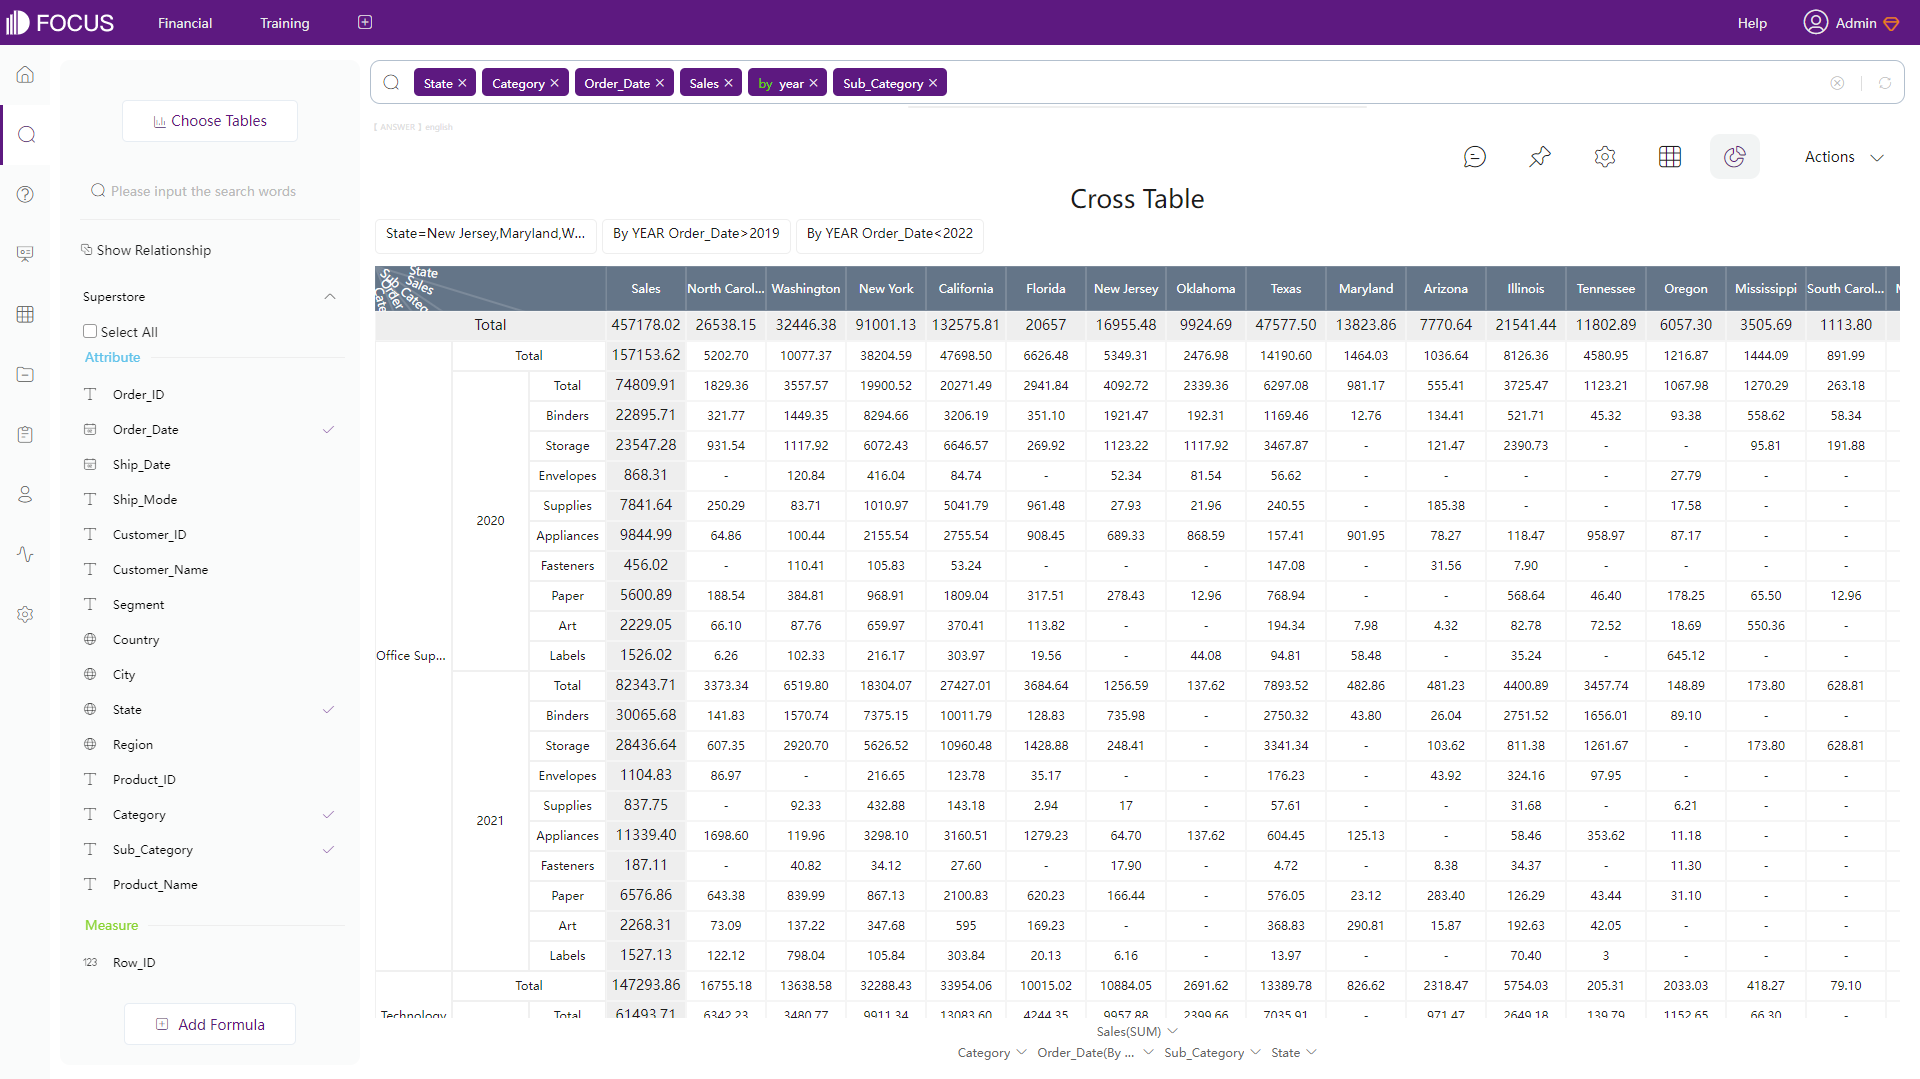
Figure 2-53 Cross table - DFC
-
-
Common Charts
Some common charts like bar charts, pie charts, line charts and scatter plots are supported by the two platforms.
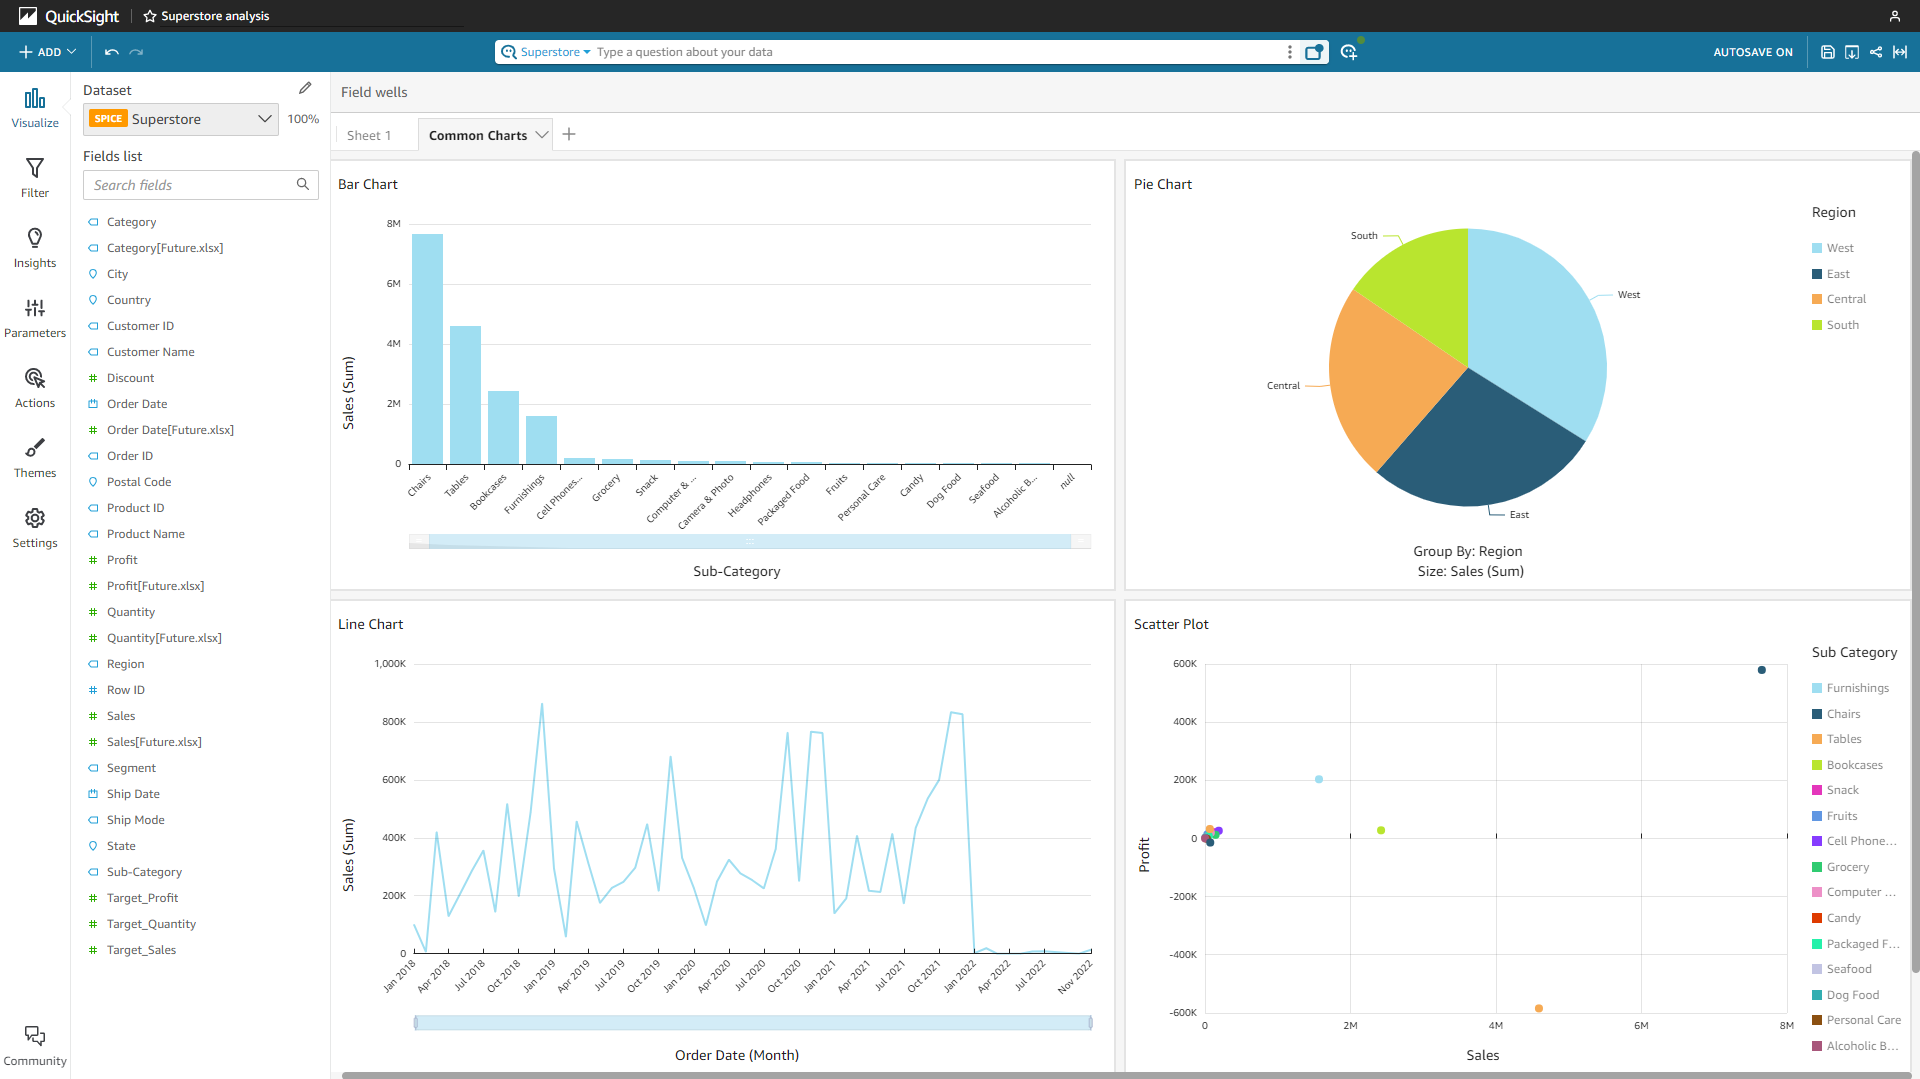
Figure 2-54 Common charts - Amazon QuickSight 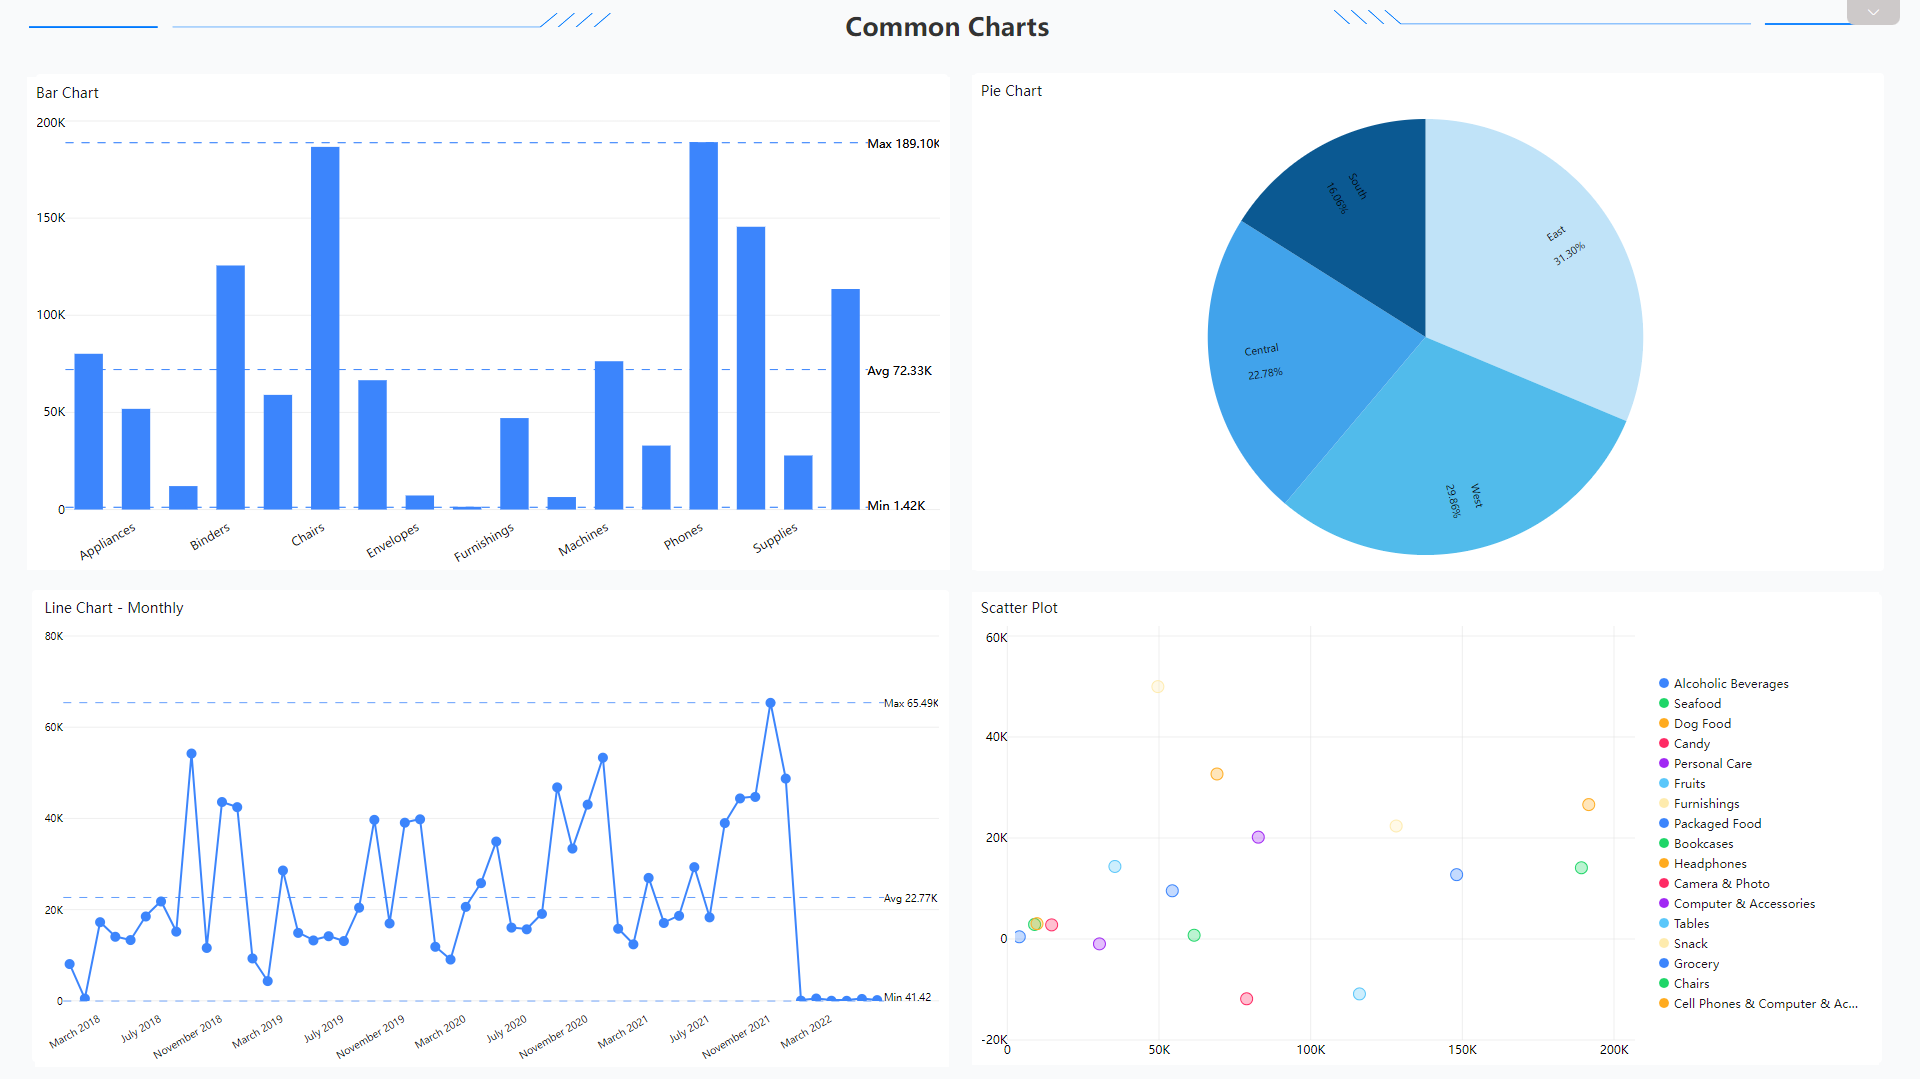
Figure 2-55 Common charts - DFC -
Maps
Amazon QuickSight has 2 map types, point map, and filled map. Users can edit the title, legend, and map type.
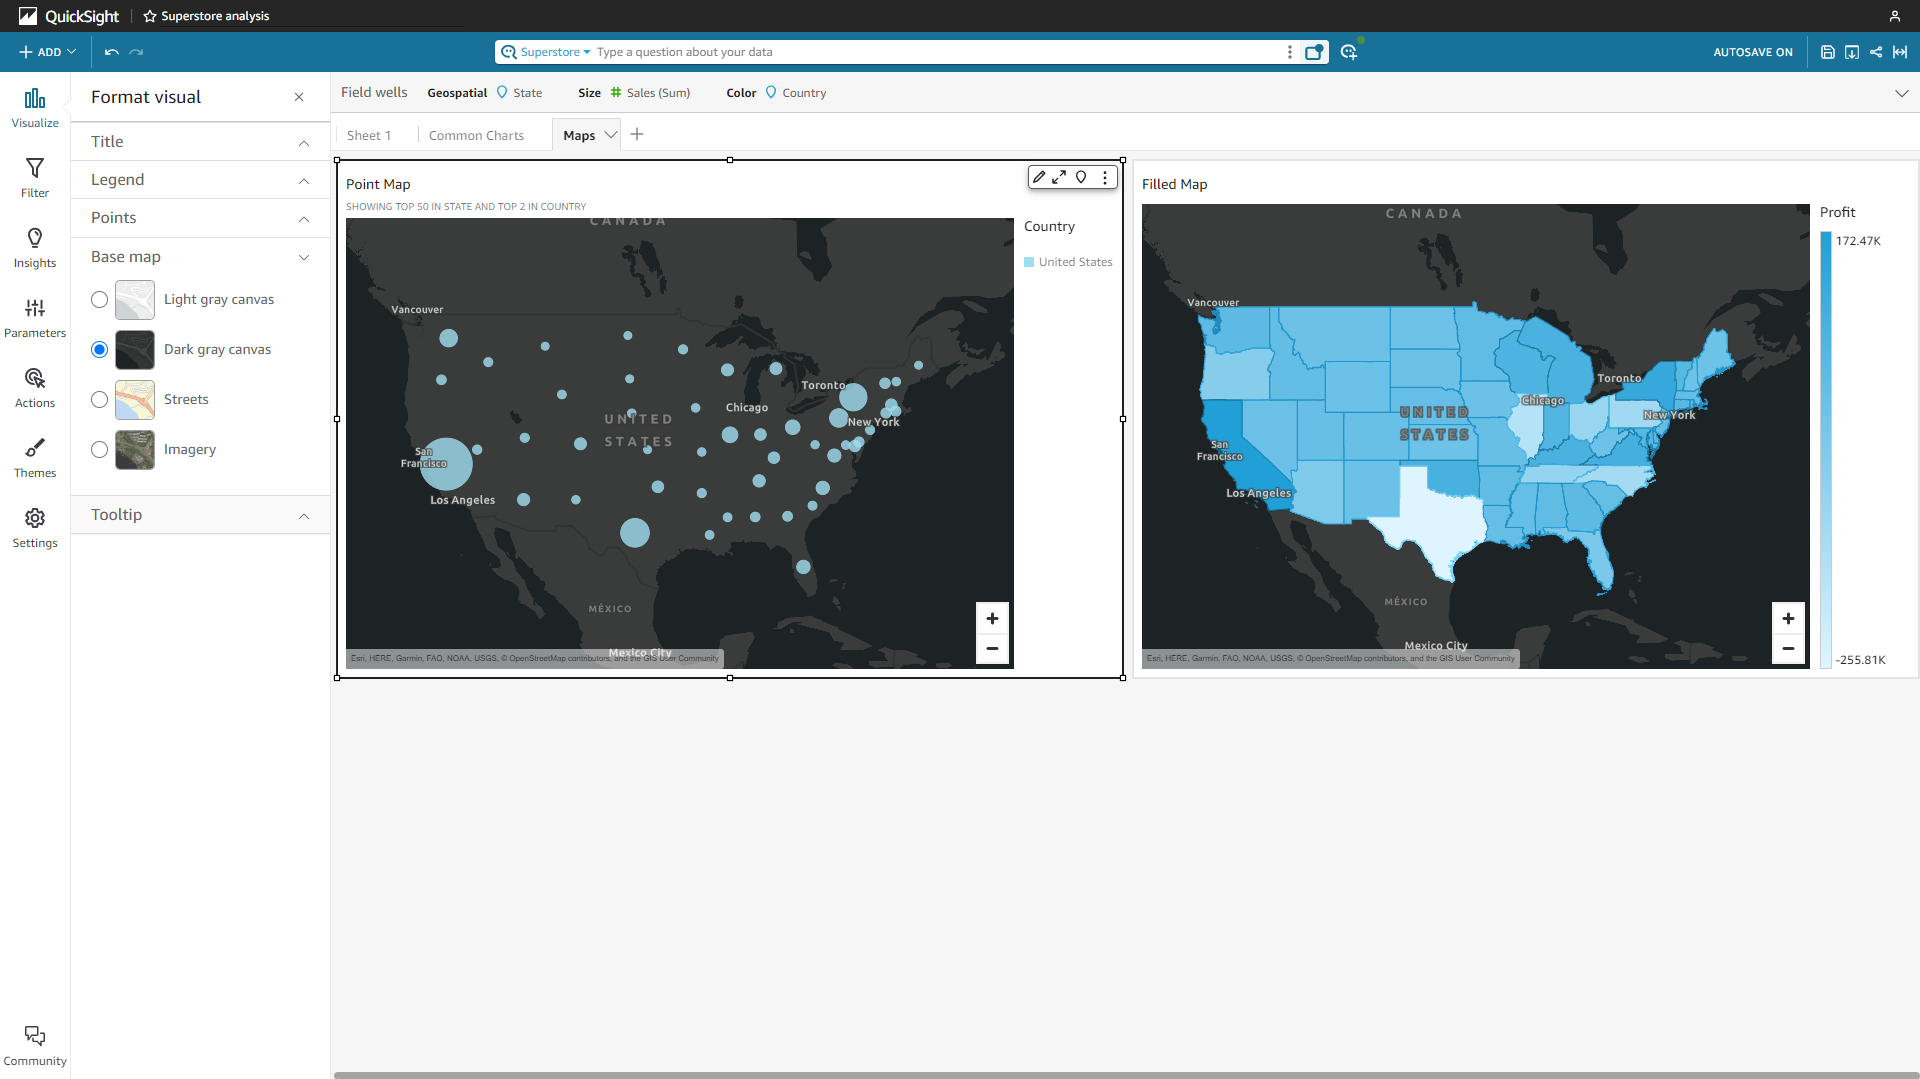
Figure 2-56 Map - Amazon QuickSight DFC has ll (longitude&latitude) location map, GIS location map, trajectory map, 3D scatter plot, etc., and users can upload custom geographical data.
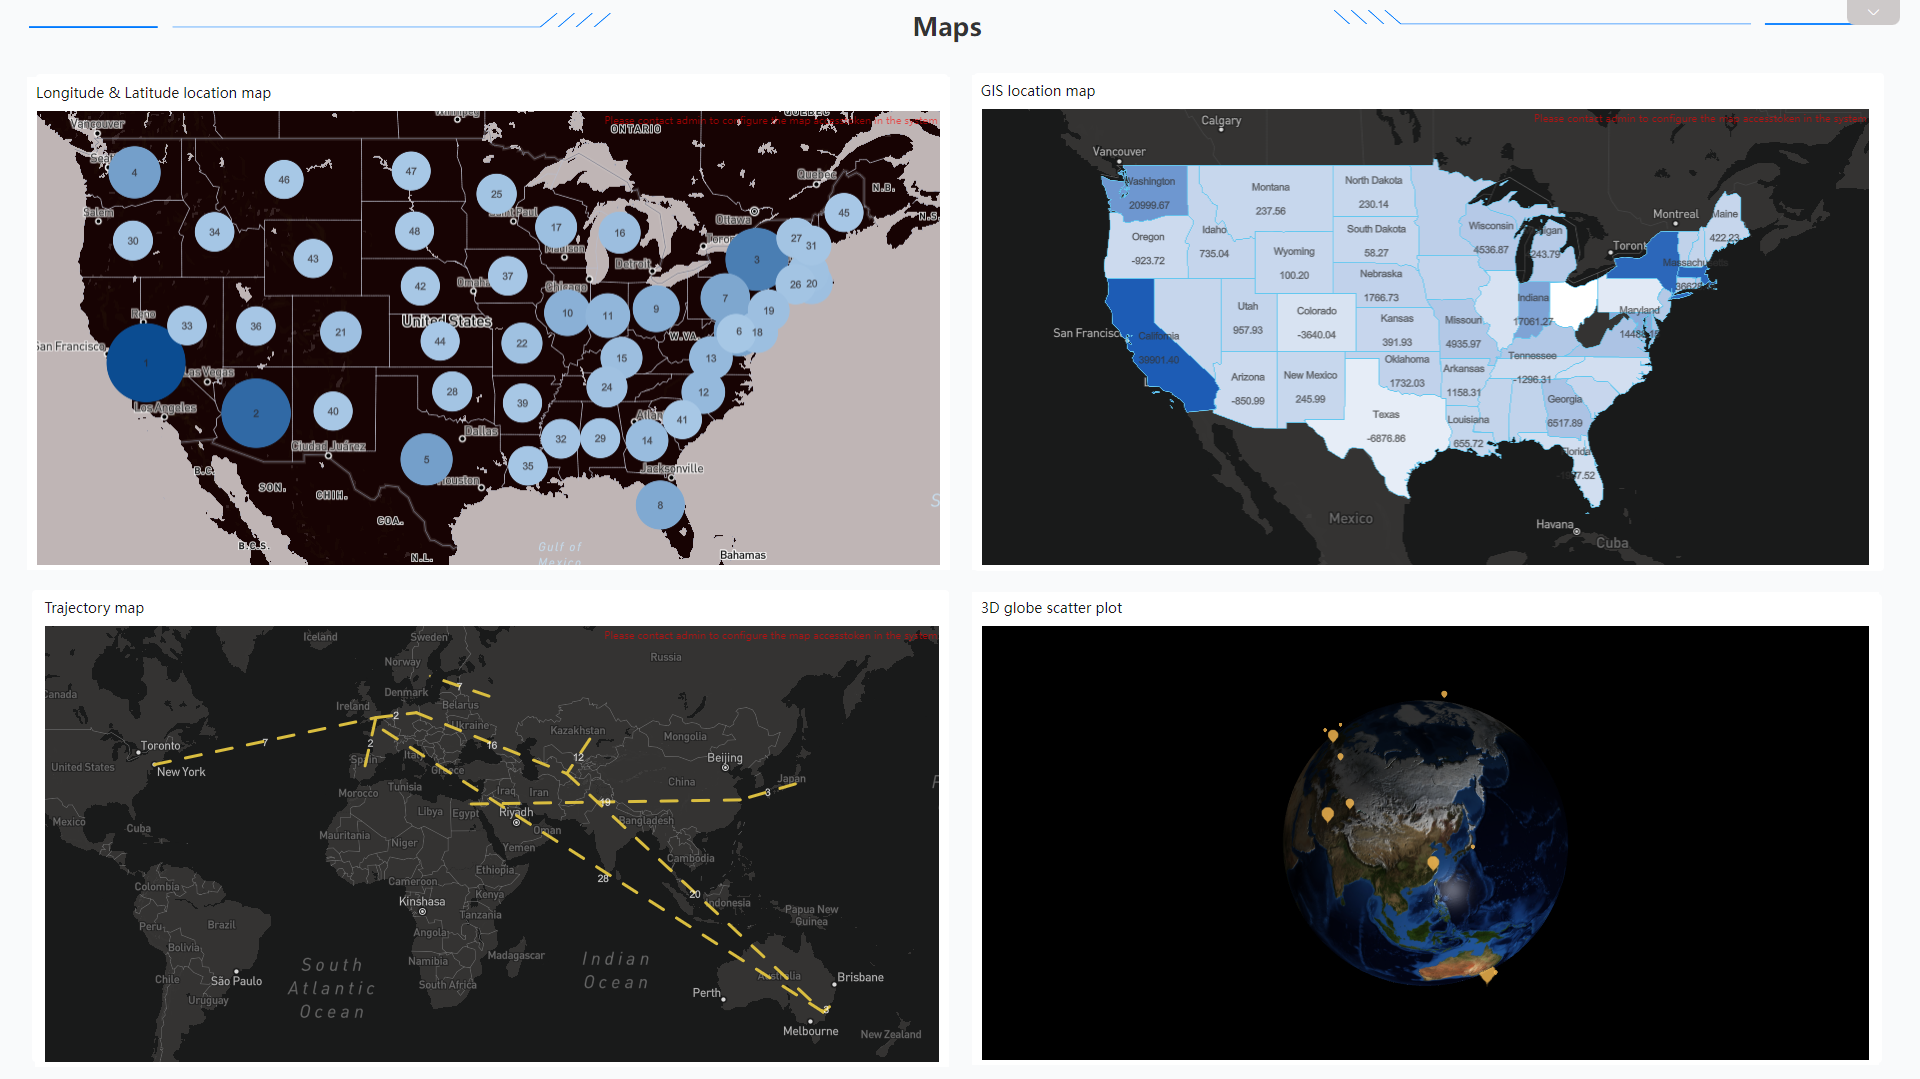
Figure 2-57 Maps - DFC -
Advanced Graphics
Some advanced charts such as boxplot, funnel chart, Sankey diagram, and radar chart.
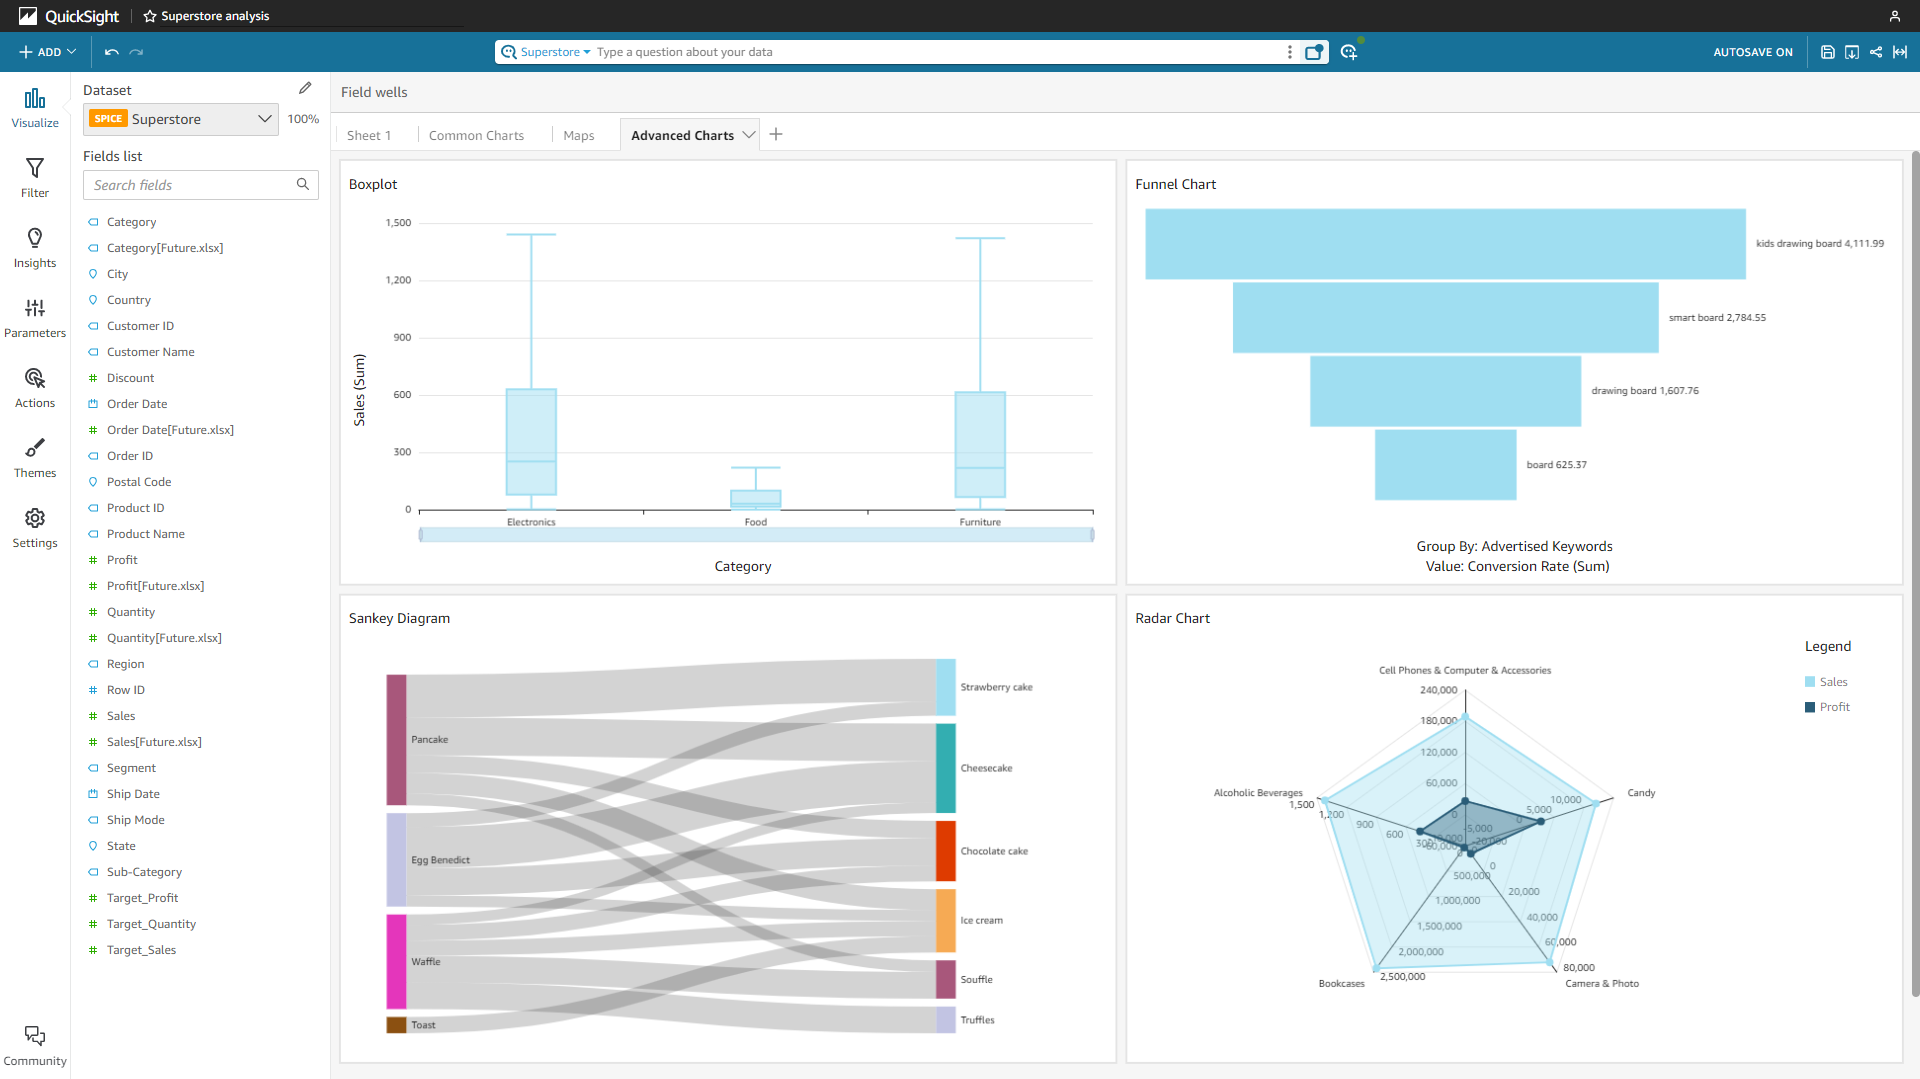
Figure 2-58 Advanced charts - Amazon QuickSight 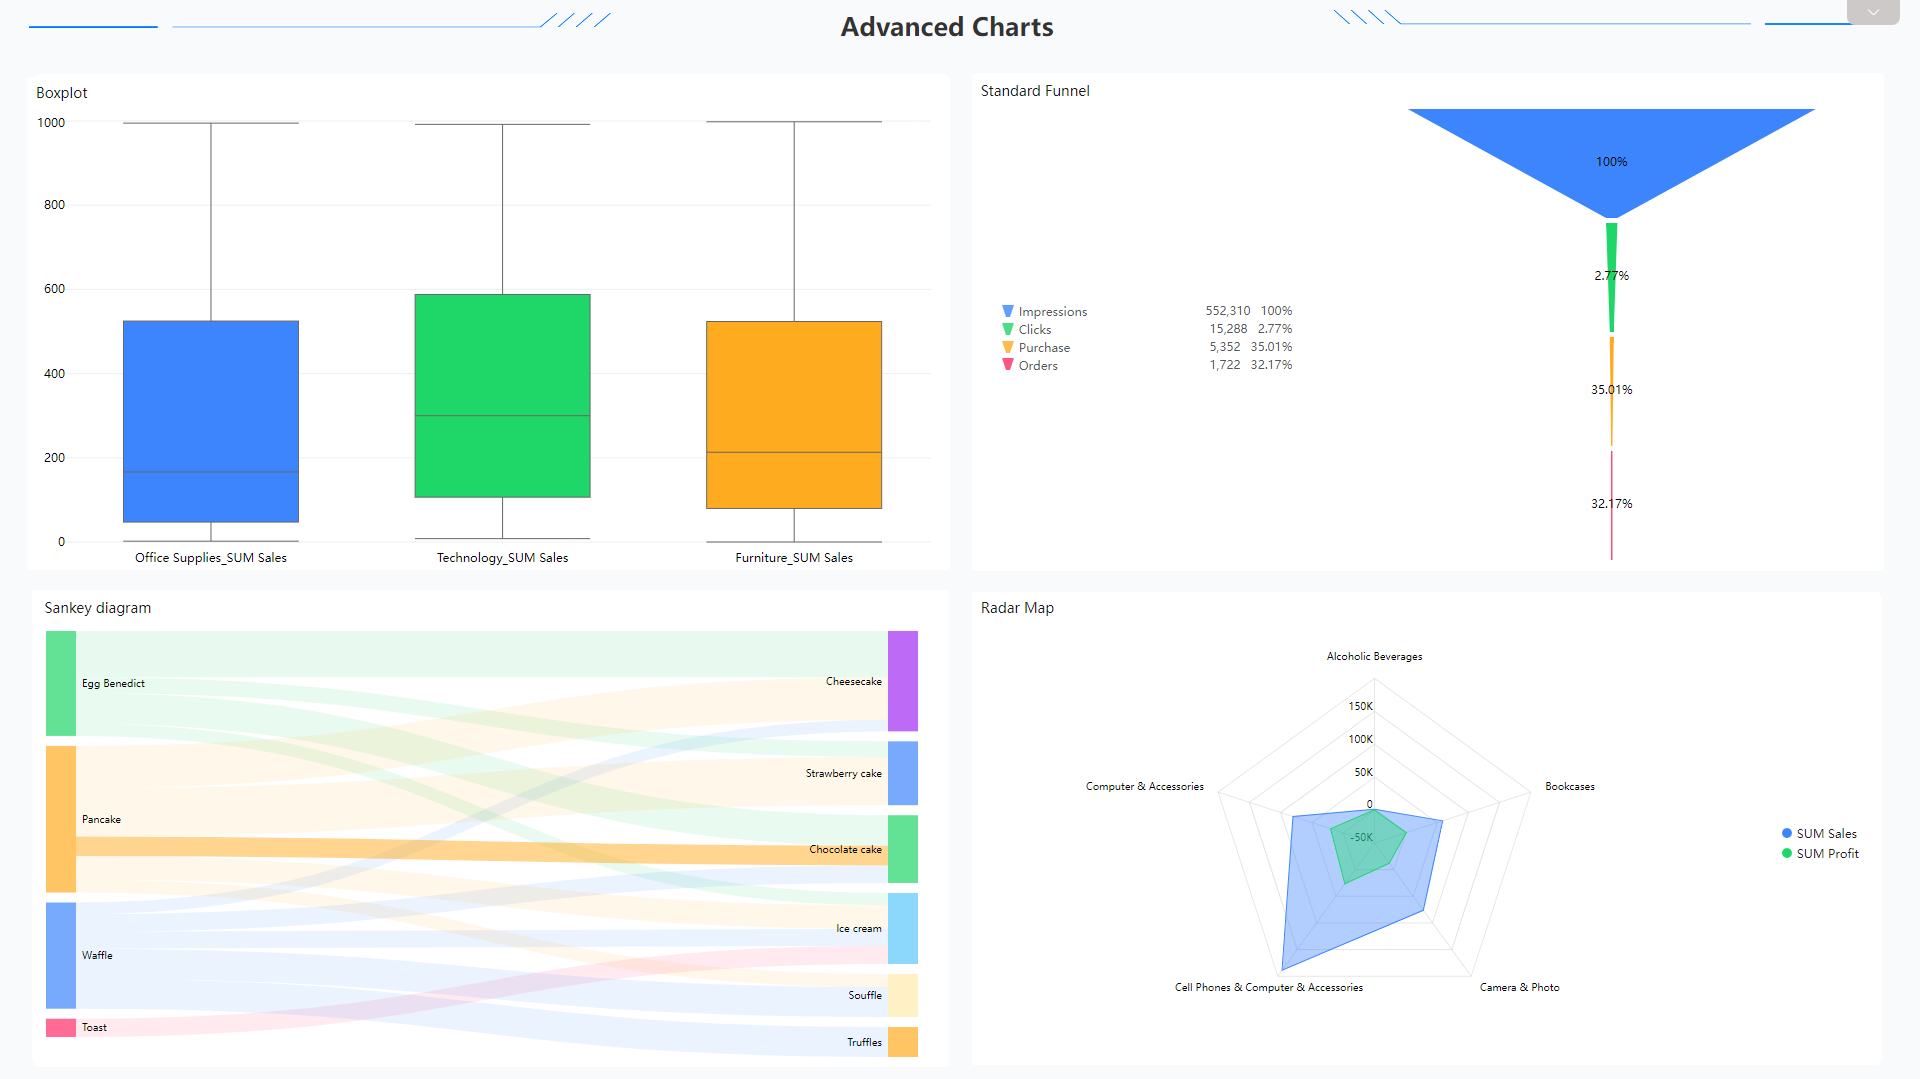
Figure 2-59 Advanced charts 1 - DFC Some other examples from DFC: sunburst diagram, correlation heatmap, chord diagram, network diagram, etc.
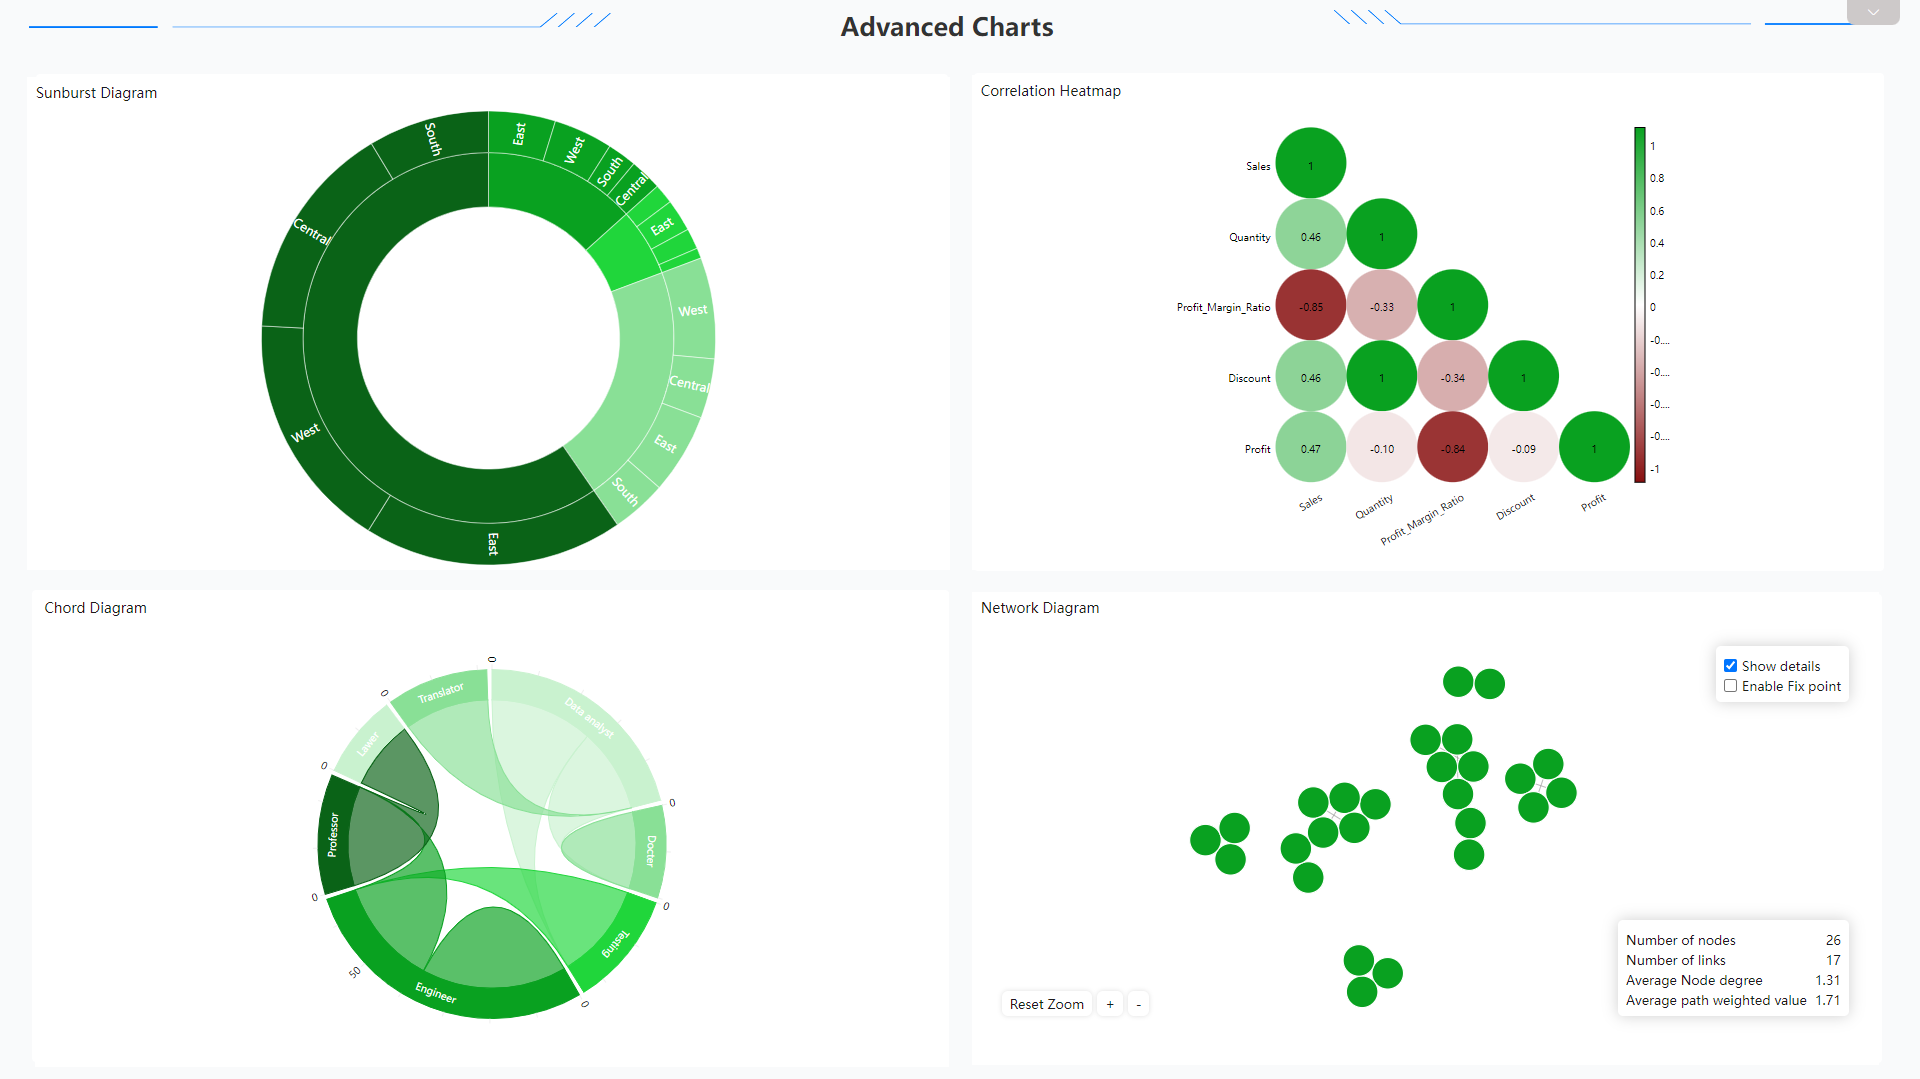
Figure 2-60 Advanced charts 2 - DFC -
Dynamic Graphics
There are also dynamic charts in DFC, such as time series bubble chart, 3D globe fly line, etc.
GIF Figure 2-61 Time series bubble chart 
GIF Figure 2-62 3D globe fly line
2.5.2 Dashboard
| Aspect | Amazon QuickSight | DataFocus Cloud |
|---|---|---|
| Dashboard Size | Fit to window | Customized |
| Layout | Tiled, free-form, classic | Grid, free |
| Background | Theme color | Custom |
| Multiple Dashboards | Sheets | Carousel/Data application |
| More | Controls | Interaction objects, dashboard templates… |
-
Dashboard Size
In Amazon QuickSight, users can choose “fit to window” to fit the dashboard to the browser window.
While in DFC, users can either use the preset sizes or customize the sizes themselves.
GIF Figure 2-63 Dashboard size - DFC -
Layout
There are three sheet layouts in Amazon QuickSight, tiled, free-form, and classic.
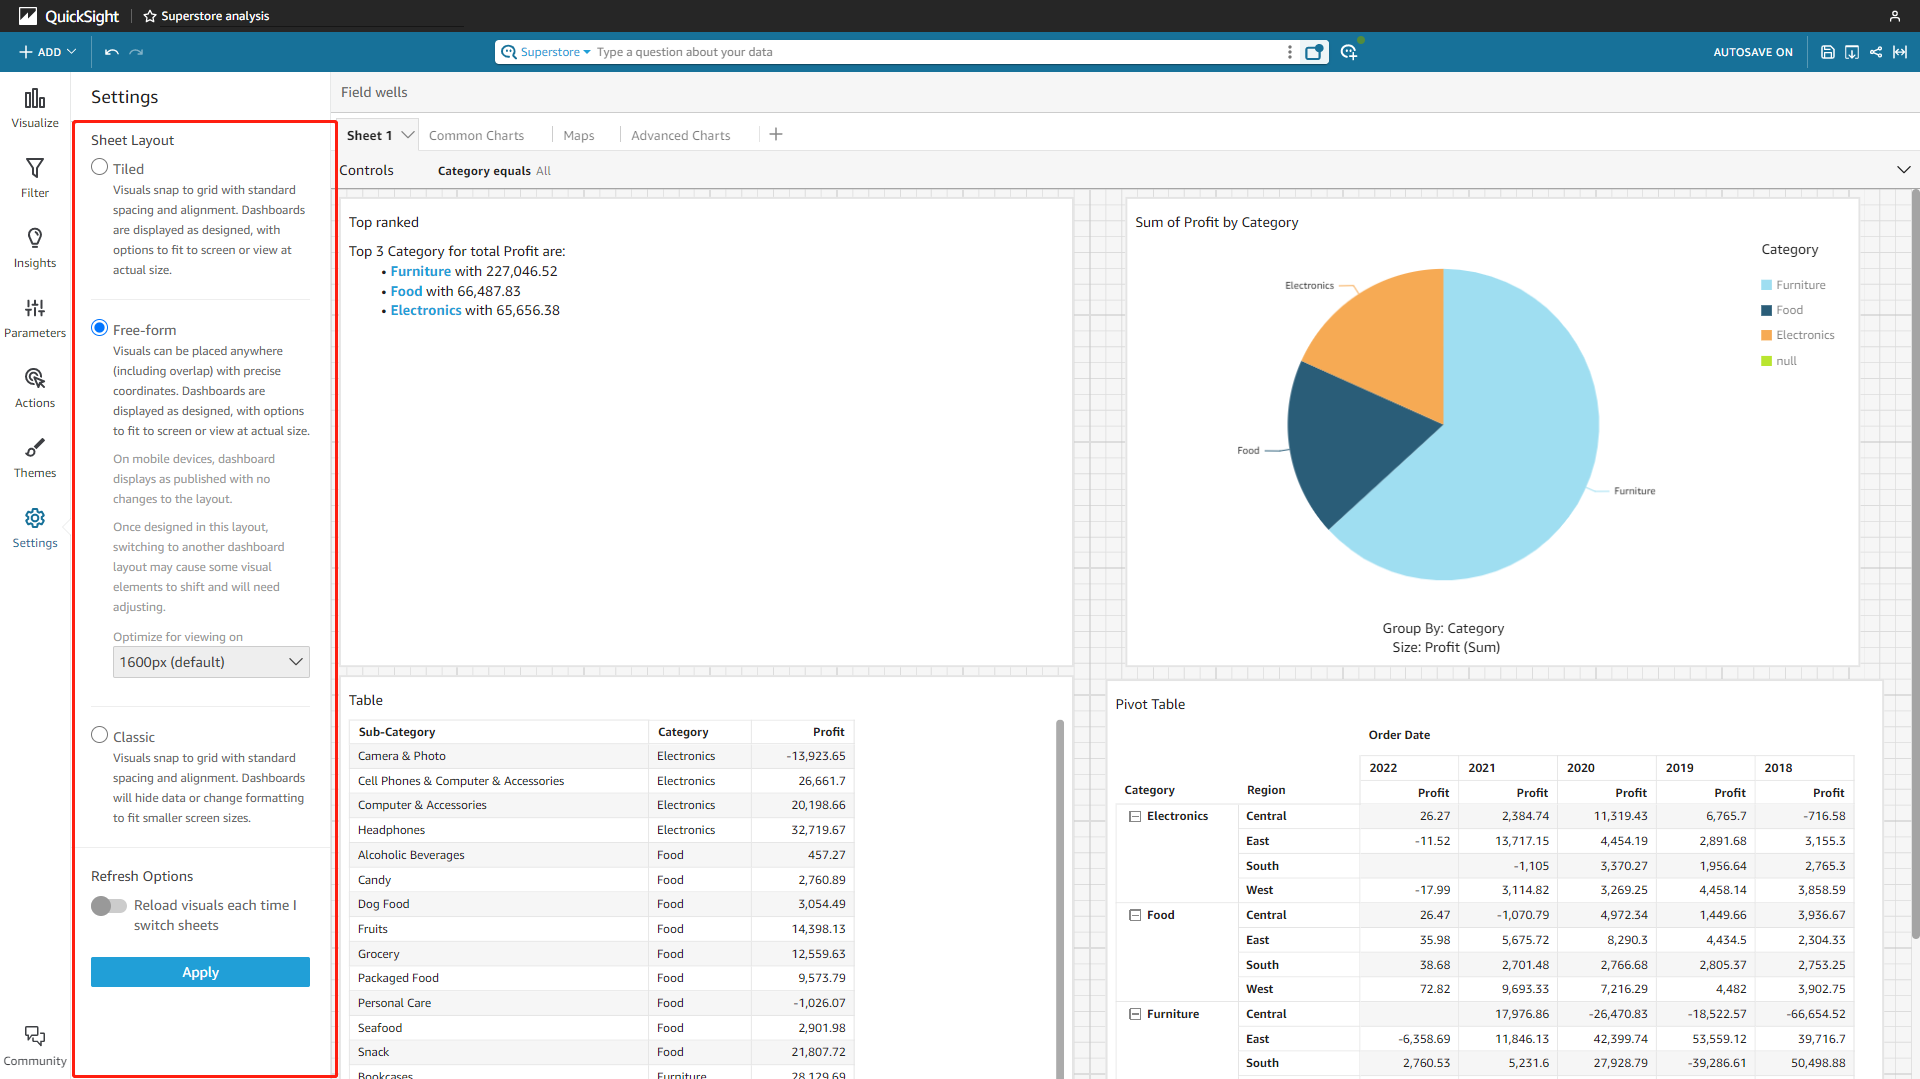
Figure 2-64 Layout - Amazon QuickSight Similarly, there are two kinds of layouts in DFC, the two layouts can be applied to both the entire dashboard and single charts.
GIF Figure 2-65 Layouts - DFC -
Background
As shown below, in Amazon QuickSight, users can choose preset themes, or design their own themes.
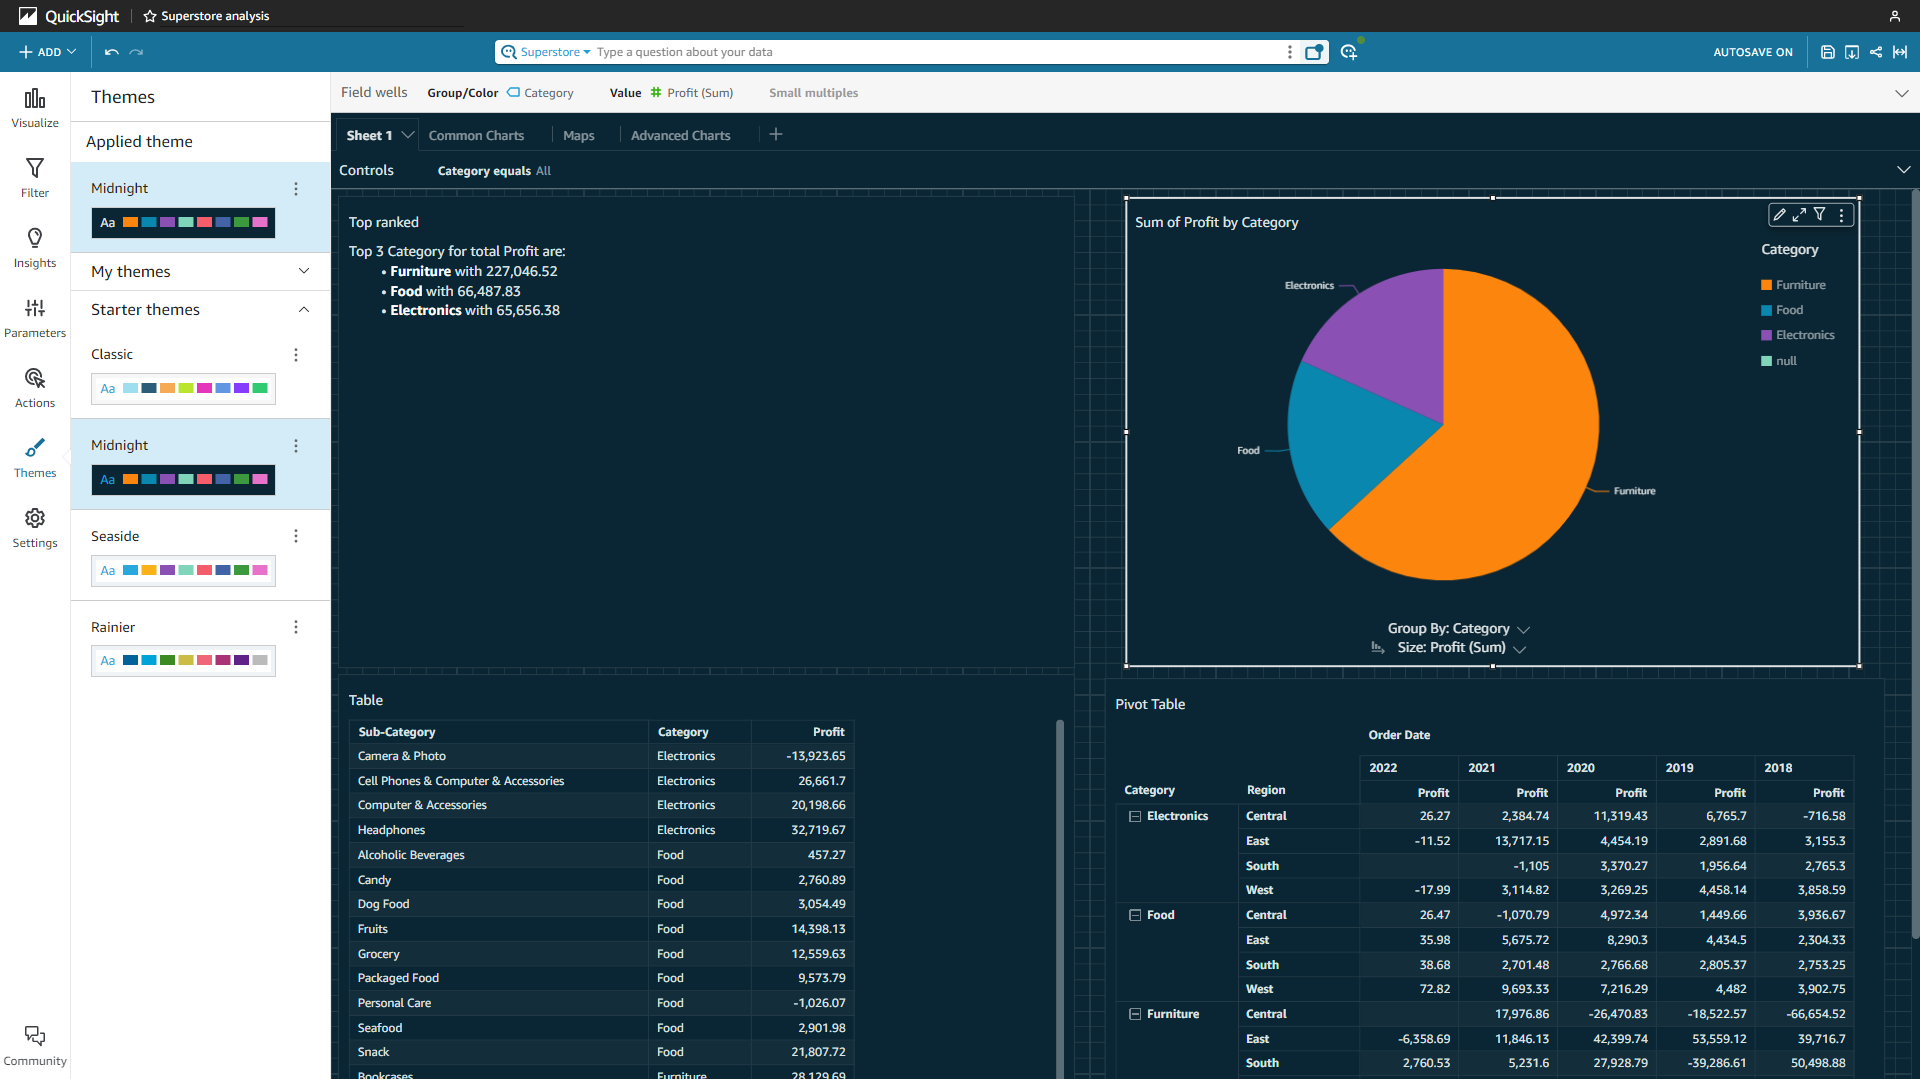
Figure 2-66 Background - Amazon QuickSight In DFC, except for customizable colors, users can also upload images to set the background.
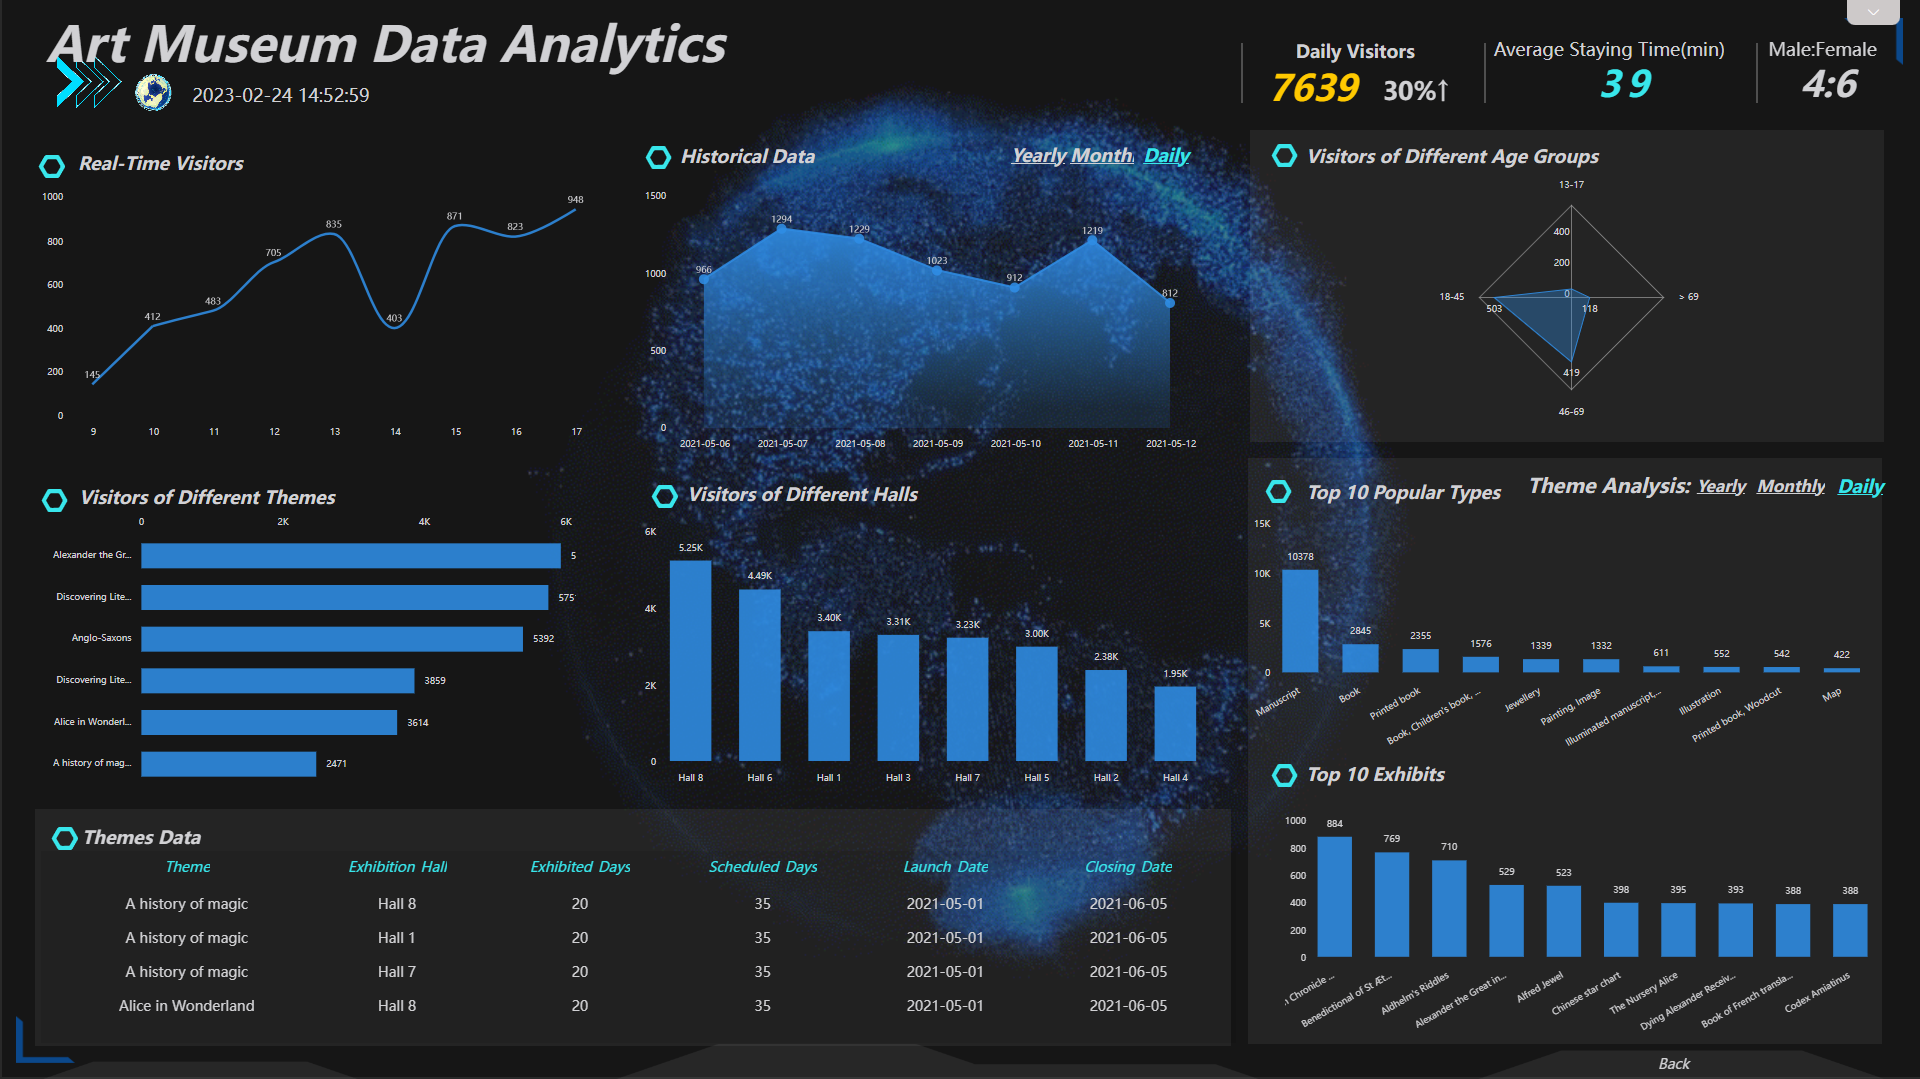
Figure 2-67 Background - DFC -
Multiple Dashboards
While Amazon QuickSight uses sheets to display multiple pages for the dashboard, DFC uses dashboard carousels and data applications to add multiple dashboards.
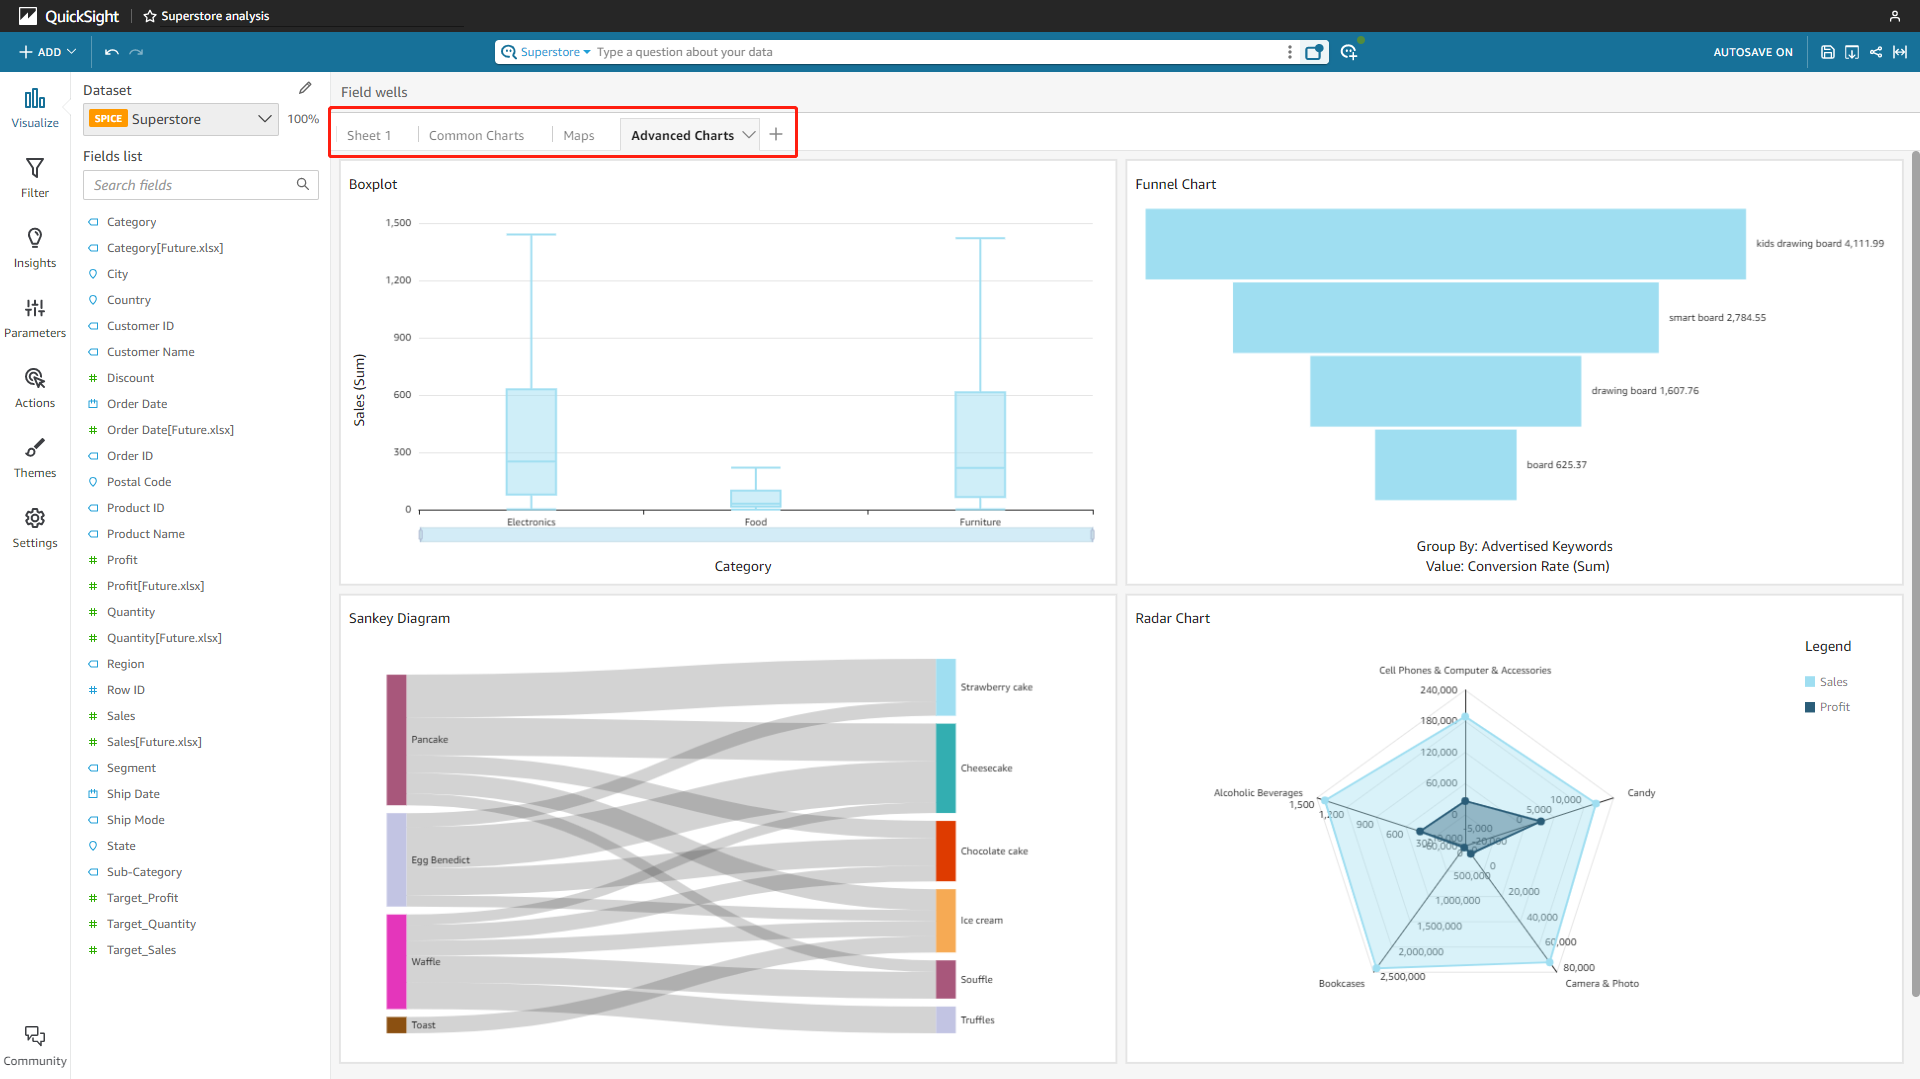
Figure 2-68 Multiple dashboards - Amazon QuickSight 
GIF Figure 2-69 Multiple dashboards - DFC -
More
Controls can be added to dashboards in Amazon QuickSight. Similarly, DFC also provides a series of interaction objects as well as custom components. What’s more, users can directly build dashboards according to templates.
Figure 2-70 Dashboard templates
2.6 Resource Management
-
Amazon QuickSight
As mentioned in section 2.1.3, resources (including datasets, analyses, and dashboards) can be stored in folders. There are filters to sort resources according to names, and users can search for the name to find resources.
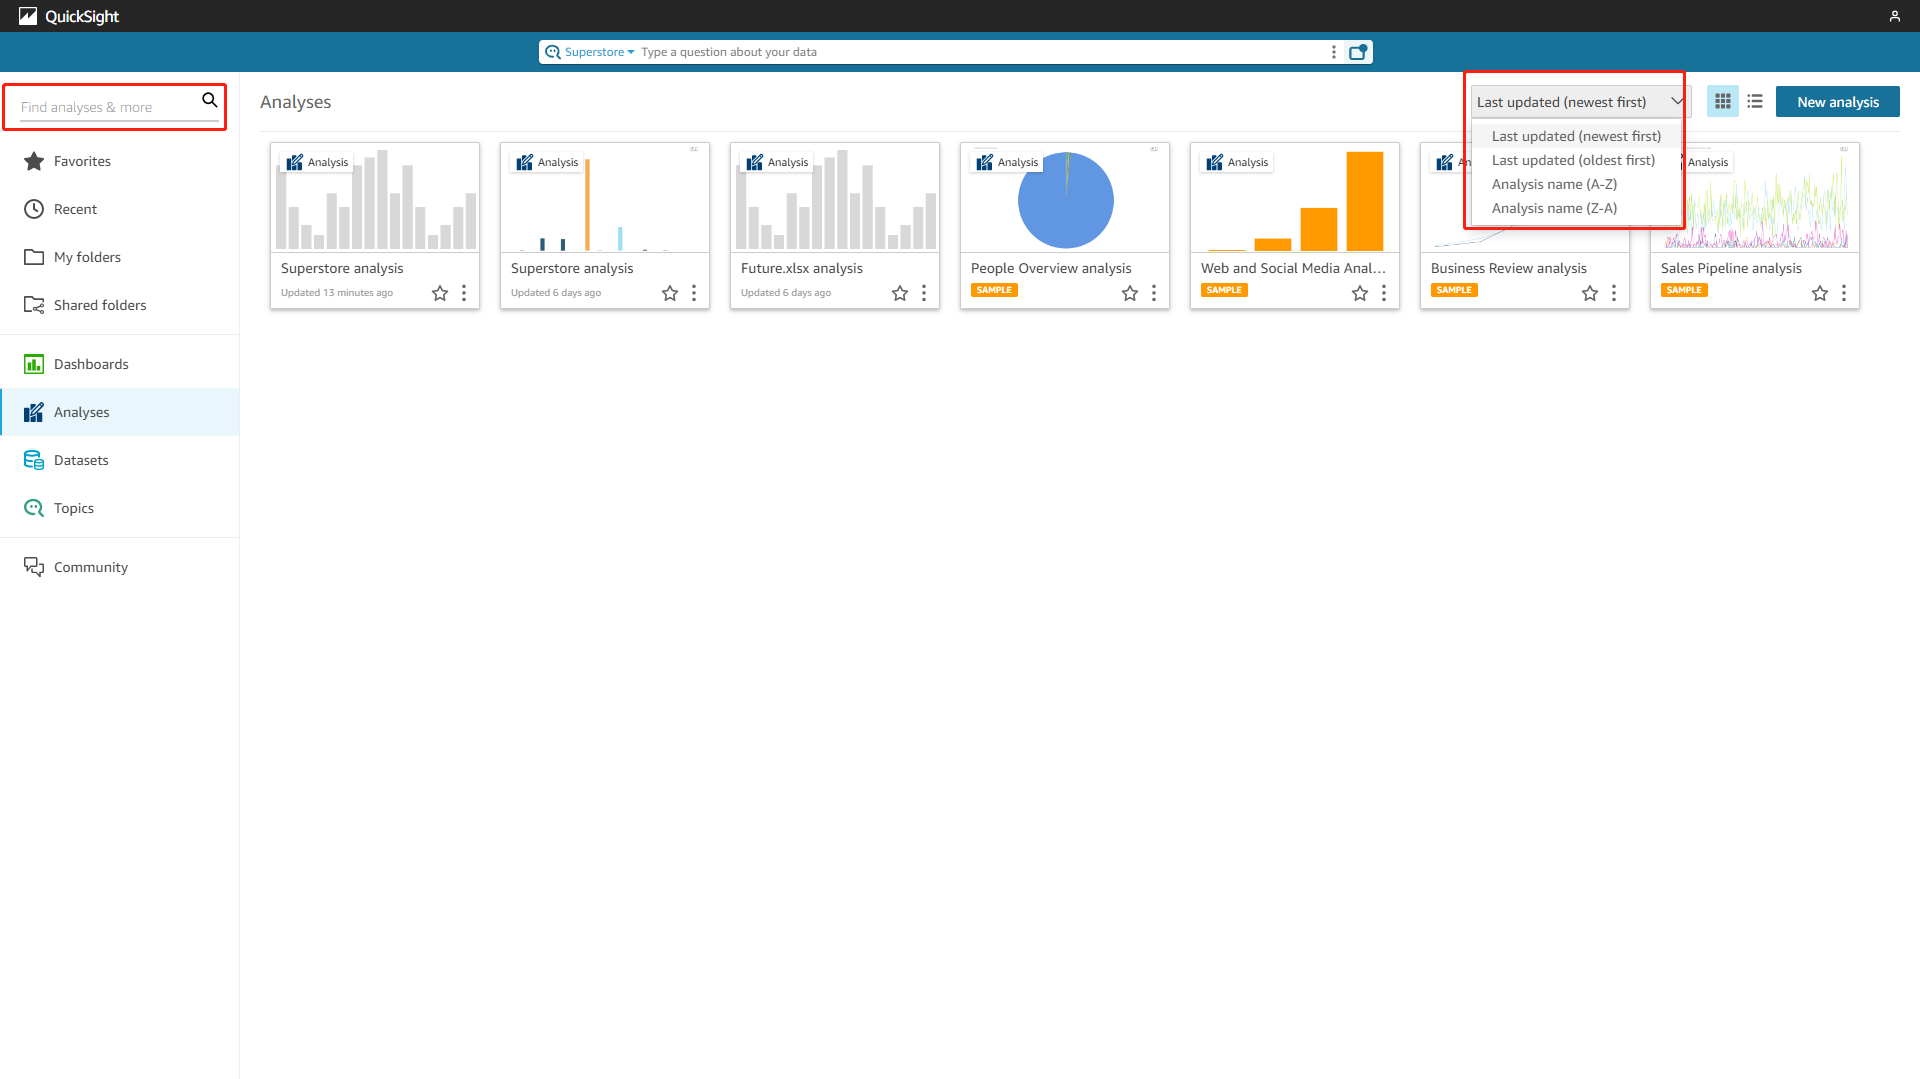
Figure 2-71 Resource management - Amazon QuickSight -
DataFocus Cloud
Similarly, resources (including tables, answers, dashboards, etc.) can be managed through projects, and each resource is stored in each module. Except for multiple filters to select data tables, tags can be applied to select resources, and also users can search for the name to find resources.
GIF Figure 2-72 Resource management - DFC
2.7 Collaboration
2.7.1 User Management
-
Permissions
Permission can be assigned to different resources.
Users can custom permissions to overall resources in Amazon QuickSight.
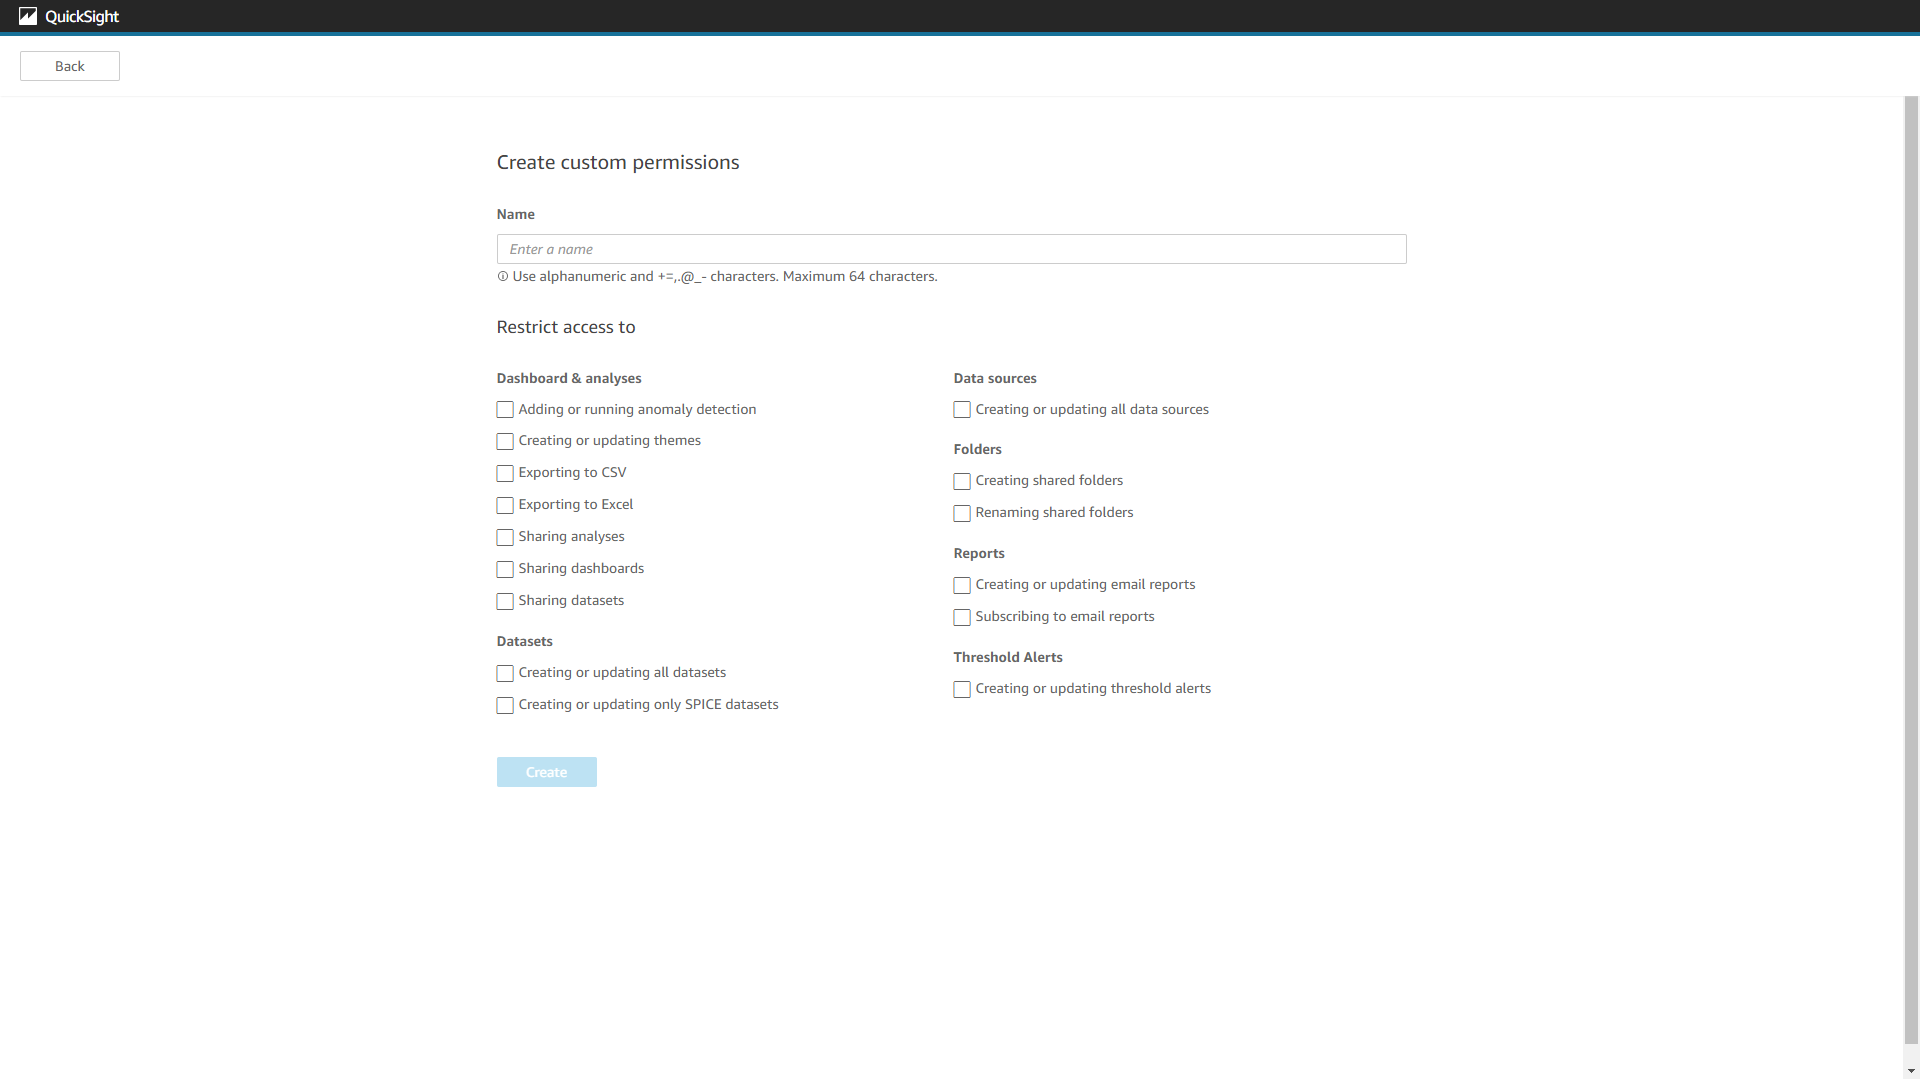
Figure 2-73 Permissions - Amazon QuickSight In DFC, permissions can also be customized, and they are down to a single resource level. For example, users can select whether to grant permission to one single dashboard. Also, for tables, permissions can be set down to column&row level, which means that some users may only view part of the table.
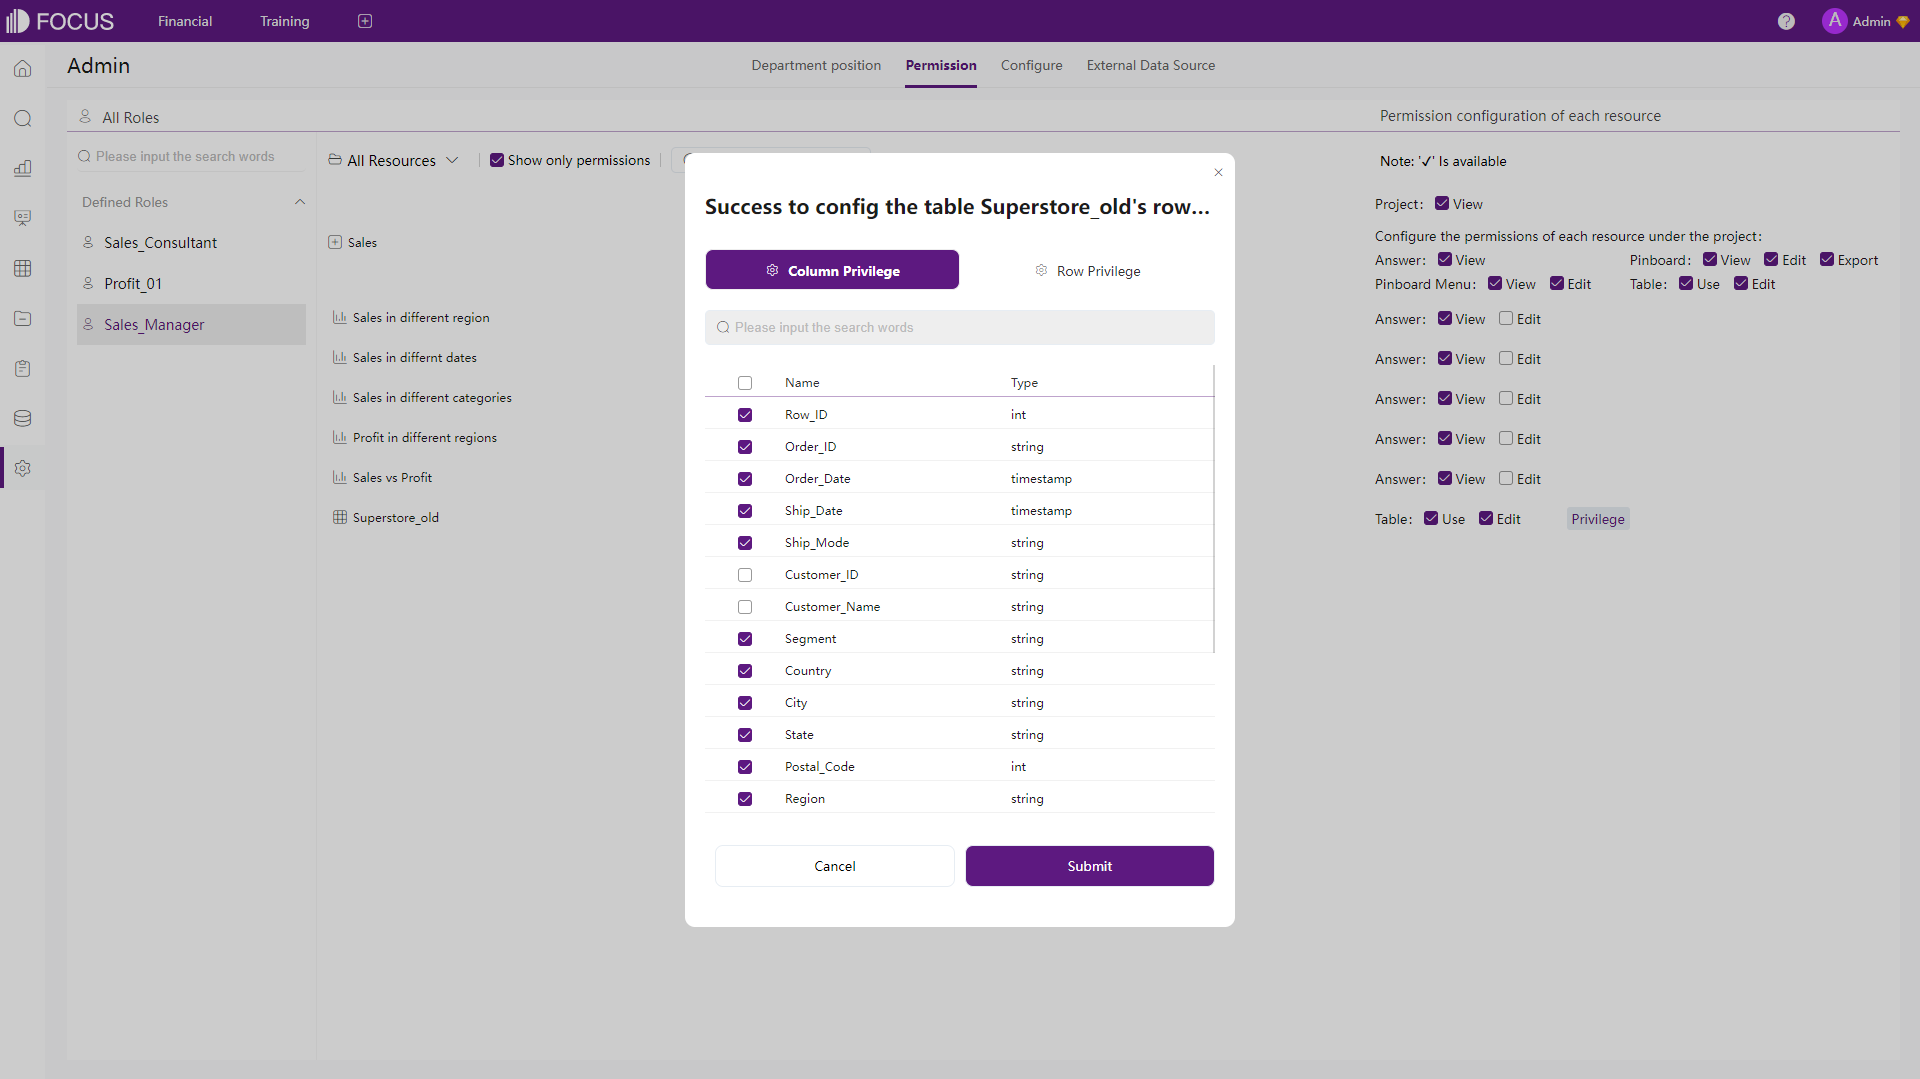
Figure 2-74 Permissions - DFC -
Roles
Roles can be applied to manage users.
In Amazon QuickSight, roles determine the permission levels for each user. There are three kinds of roles, admin, author, and reader, where a reader can only interact with shared dashboards, an author can author analyses and dashboards, and an admin can also perform administrative tasks.
DFC’s Roles can be regarded as system roles and custom roles. Custom roles can be assigned with different permissions, and users with different roles would have different grants towards different resources. For example, a “Financial Manager” can manage all resources related to financing, while a “Financial - Sales” can only manage resources related to sales.
2.7.2 Share
Both Amazon QuickSight and DataFocus Cloud provide multiple ways to share resources. Users can share resources within the system, by email, or use links for external users to interact with dashboards.
2.7.3 More
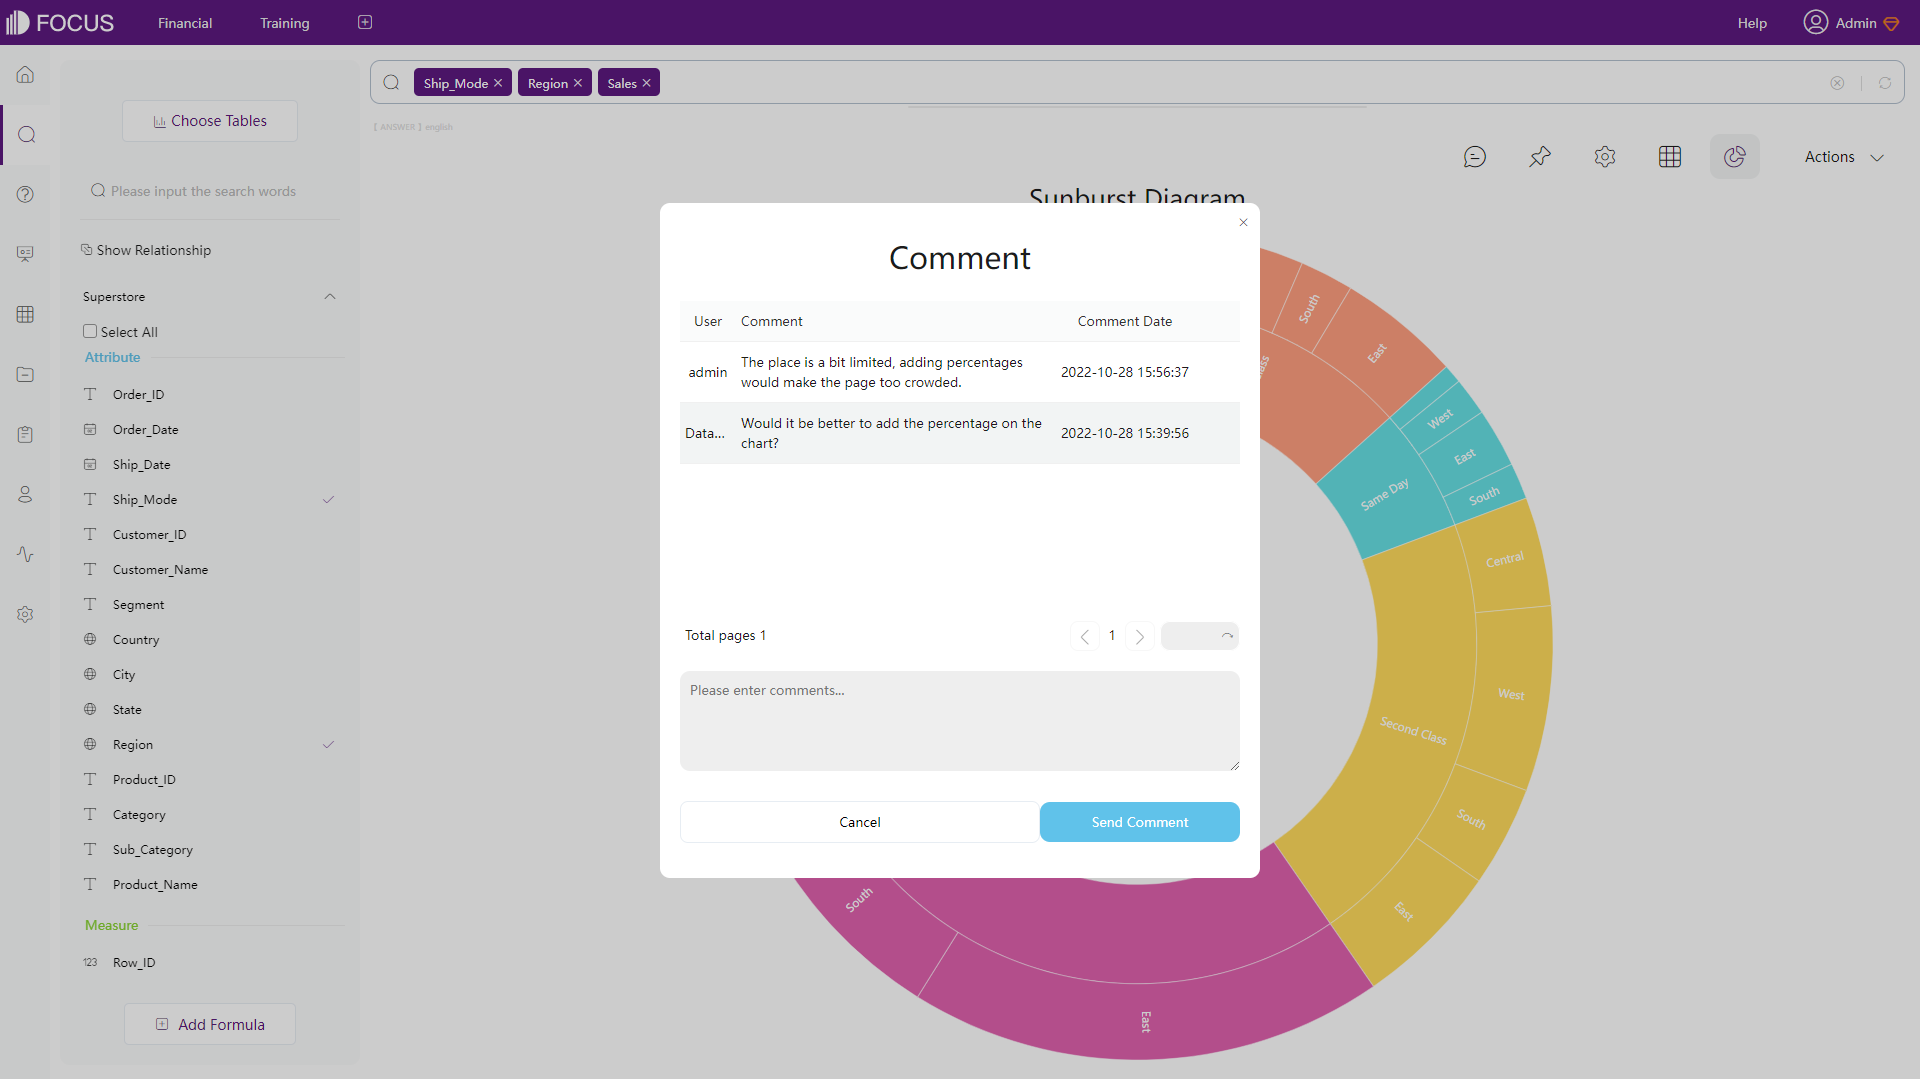
DFC also supports the comment. This feature allows team members to communicate with each other about the chart.
2.8 Cost
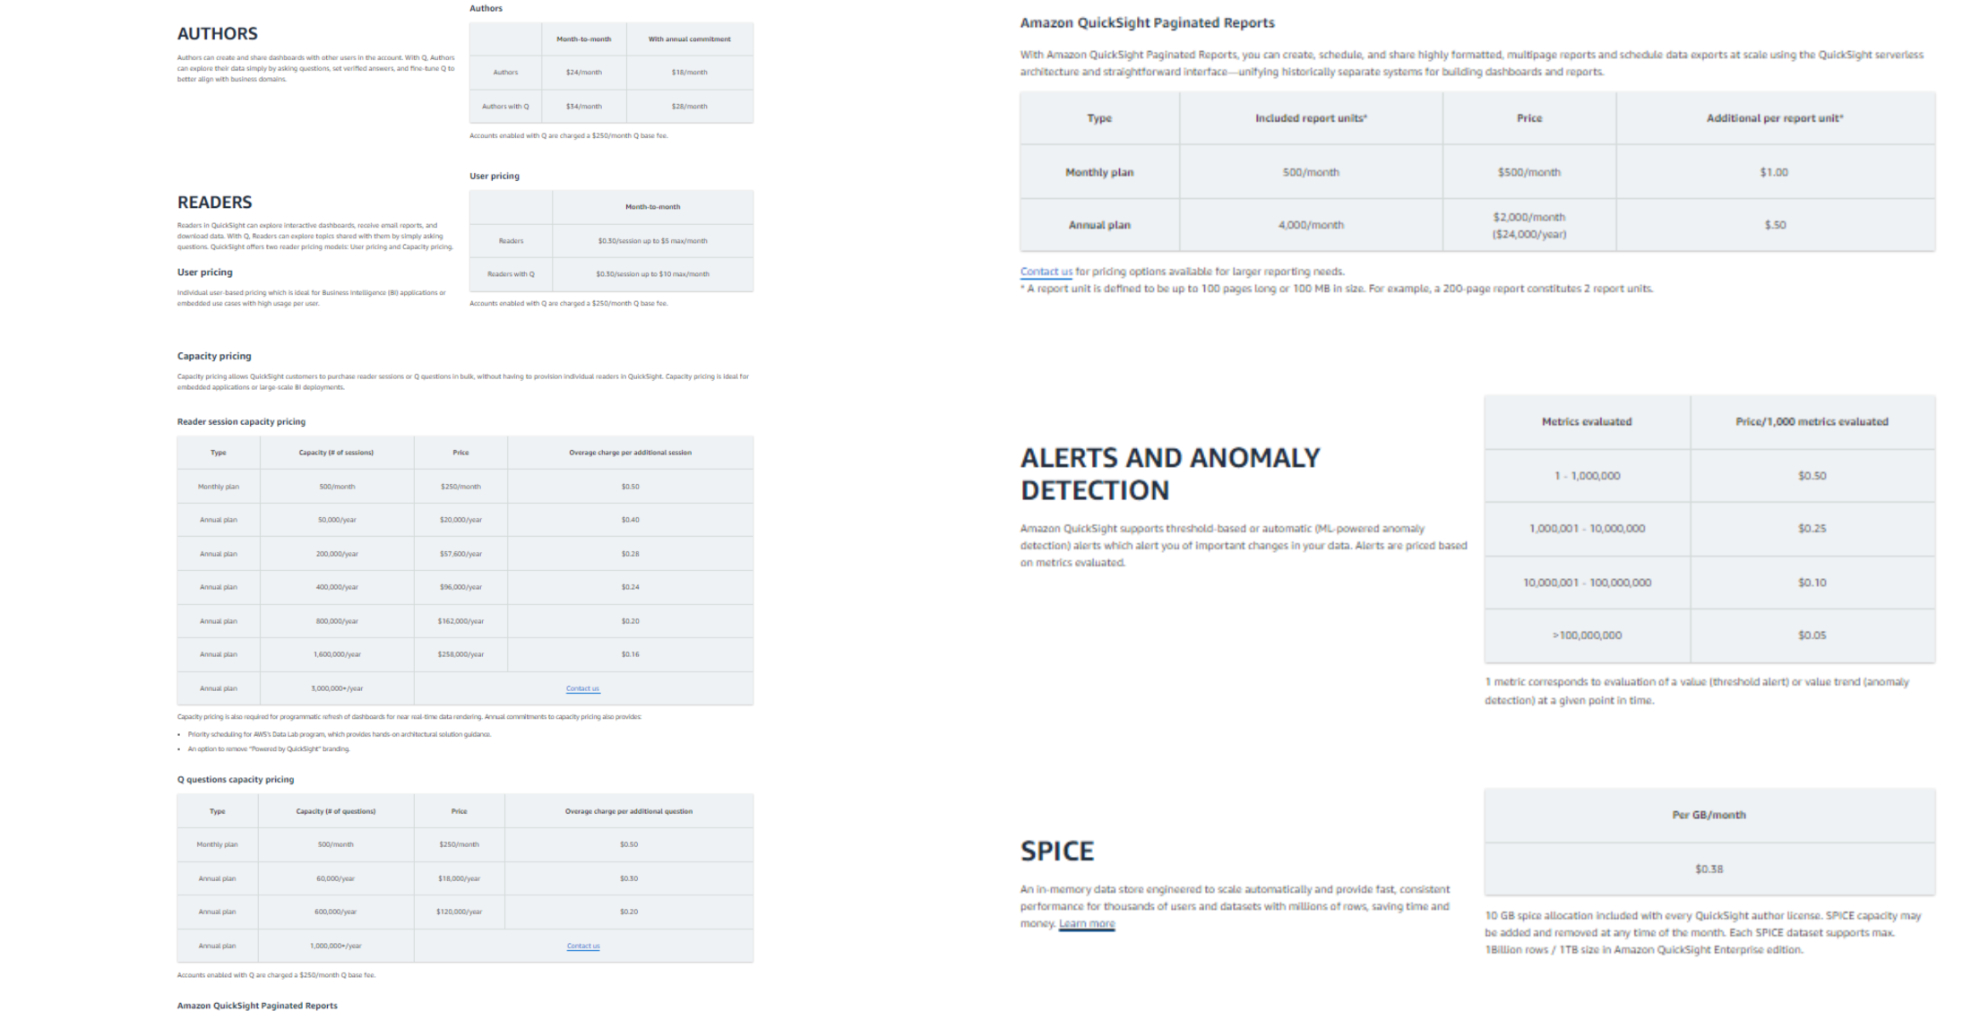
Amazon QuickSight has quite complex pricing plans. In terms of the enterprise edition, the pricing plan includes charging by roles, capacity, and some others like paginated reports, alerts, spice, etc. Charging by roles is expensive for organizations and teams, the expenses rise linearly and are difficult to measure.
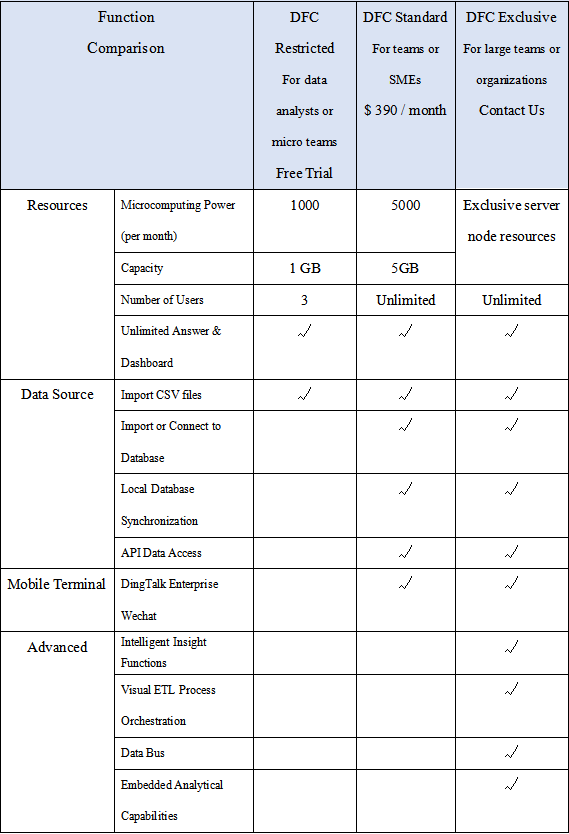
On the other hand, DFC has a simple pricing plan, which only charges by capacity. In this way, the number of users is not essential to consider. It is fairer and simpler to spread across teams. Here is the pricing plan of DFC.
3. Conclusion
In conclusion, both DataFocus Cloud and Amazon QuickSight are powerful tools that offer a range of features for data visualization and analytics. By understanding the unique features and capabilities of both platforms, users can make an informed decision about which tool is best for their specific business needs.
Amazon QuickSight has wonderful features such as QuickSight Q, which allows users to use natural language to bring out insights. Though there are still limits, the system would keep improving.
DataFocus Cloud allows businesses of all sizes to gain insights into their data and make informed decisions quickly and easily. Its intuitive interface, user-friendly tools, and advanced features make it a valuable asset for any business looking to stay ahead in today’s data-driven world. It will keep trying to make the user experience better. Try out here: DFC.
