Tableau Cloud vs DataFocus Cloud
Business intelligence (BI) has been around for nearly 60 years since it was created by the once-great Big Blue IBM. Various BI technologies emerged to help analyze and visualize data. Tableau Cloud and DataFocus Cloud are two excellent software-as-a-service (SaaS) platforms, helping business people fulfill analysis needs.
Aiming at business elites without data analysis experiences, DataFocus provides various data sources, ease of use, simple but comprehensive data processing, high degree of customization in visualization, systematic resource management as well as collaboration and fair costs.
To find the most appropriate one for each business elite, here are the difference between the two products.
1. Introduction
Tableau Cloud (Tableau below) is a drag-and-drop visual analytics SaaS platform. Aiming at improving the flow of analysis, Tableau makes data more accessible to business people through visualization in the form of beautiful dashboards, reports, stories.
DataFocus Cloud (DataFocus below) is a search-based analysis SaaS platform with full-stack functionality. Aiming at turning business elites into data experts, DataFocus makes data understand human language.
Both of them are excellent data analysis and data visualization tool, here are the differences between them to help users select the most suitable one according to needs.
2. Tableau Cloud vs. DataFocus Cloud
2.1 Core Audience
Tableau has beautiful visualizations and once you are familiar with it, you can create various advanced charts. However, Tableau has a high threshold and is difficult to get started. Therefore, it is more suitable for professional data analysts with experience, while novices or normal business people may be at a loss when learning how to deal with data or realize visualization in Tableau.
DataFocus aims at turning business elites into data experts. With low threshold and learning cost, DataFocus also provides beautiful visualization. Rather than drag-and-drop analysis like Tableau, DataFocus offers search-based analysis, making data understand human language. Therefore, it is more suitable for any data analyst or normal business elites.
2.2 Data Source
Tableau supports various data sources: you can upload Excel or text-based data sources from local, or you can connect to data housed in a cloud database or on a server in the enterprise, or to use Tableau Server REST API to access simple functionality behind data sources. Also, Users can use Tableau Bridge to keep data fresh.
DataFocus provides 4 different ways of retrieving data.
- Upload CSV, Excel and JSON files from local;
- Import data warehouse, which fits big data scenarios such as billions of data;
- Directly connect to databases, using DataFocus as a data warehouse, so that data, charts and visualization dashboards can be updated in real-time. Also, different databases can be connected at the same time, so that tables from different databases can be joined and analyzed in real-time;
- Use data access API to authorize external applications, allowing external users to import data by calling API interfaces.
Here are the detailed data sources:
| Files From Local | External Data Sources |
|---|---|
| CSV (.csv) EXCEL (.xls, .xlsx) JSON (.json) |
PostgreSQL/RDS PostgreSQL MYSQL/RDS MYSQL/RDS MariaDB TX Oracle IBM DB2 SQL Server/RDS SQL Server Sybase Pivotal Greenplum Kudu ElasticSearch TeraData MongoDB Prometheus Hive Delta Lake IceBerg |
2.3 Ease of Use
2.3.1 Interaction Mode
Tableau utilize the drag-and-drop operation to create charts, dashboards and stories. While drag-and-drop has its own benefits to build its unique interactions, it is actually time consuming when the visualization is advanced.
DataFocus provides search-based analysis which is simple and fast. As shown in gif figure 2-1, by typing needs in the search box, the system will return result automatically, no matter the chart is advanced or not.
The 2 different interaction modes lead to different focus. Tableau’s drag-and-drop operation aims at drawing graphics, and thus makes users concentrate on how to realize visualization. The search-based operation makes users concentrate on analytics, where users can search and analyze whatever occurred in their minds.
2.3.2 Filter
There are mainly three ways to add various filters in Tableau.
The simplest way is by selecting: you can select data points to or headers to include or exclude data in the view. Another simple way is by displaying interactive filters in the view, while filter cards can be customized.
These two ways can include or exclude data quickly. However, to add more advanced filters, you need to drag dimensions, measures or date fields to the “Filters” shelf. Then, take date field as an example, there are various filters to choose from, including relative dates, individual dates, weekdays, and etc.
However, the interface is quite complex and once the filter is created, the type of the filter can not be edited, i.e. you can’t make a “Relative Date” filter into a “Individual Dates” filter.
There are four ways to add filters in DataFocus.
Similar to Tableau, you can also select areas to include data and click “Reset” button to show the hidden data, as shown in gif figure 2-2.
Another is to filter on the interface of the grid table.
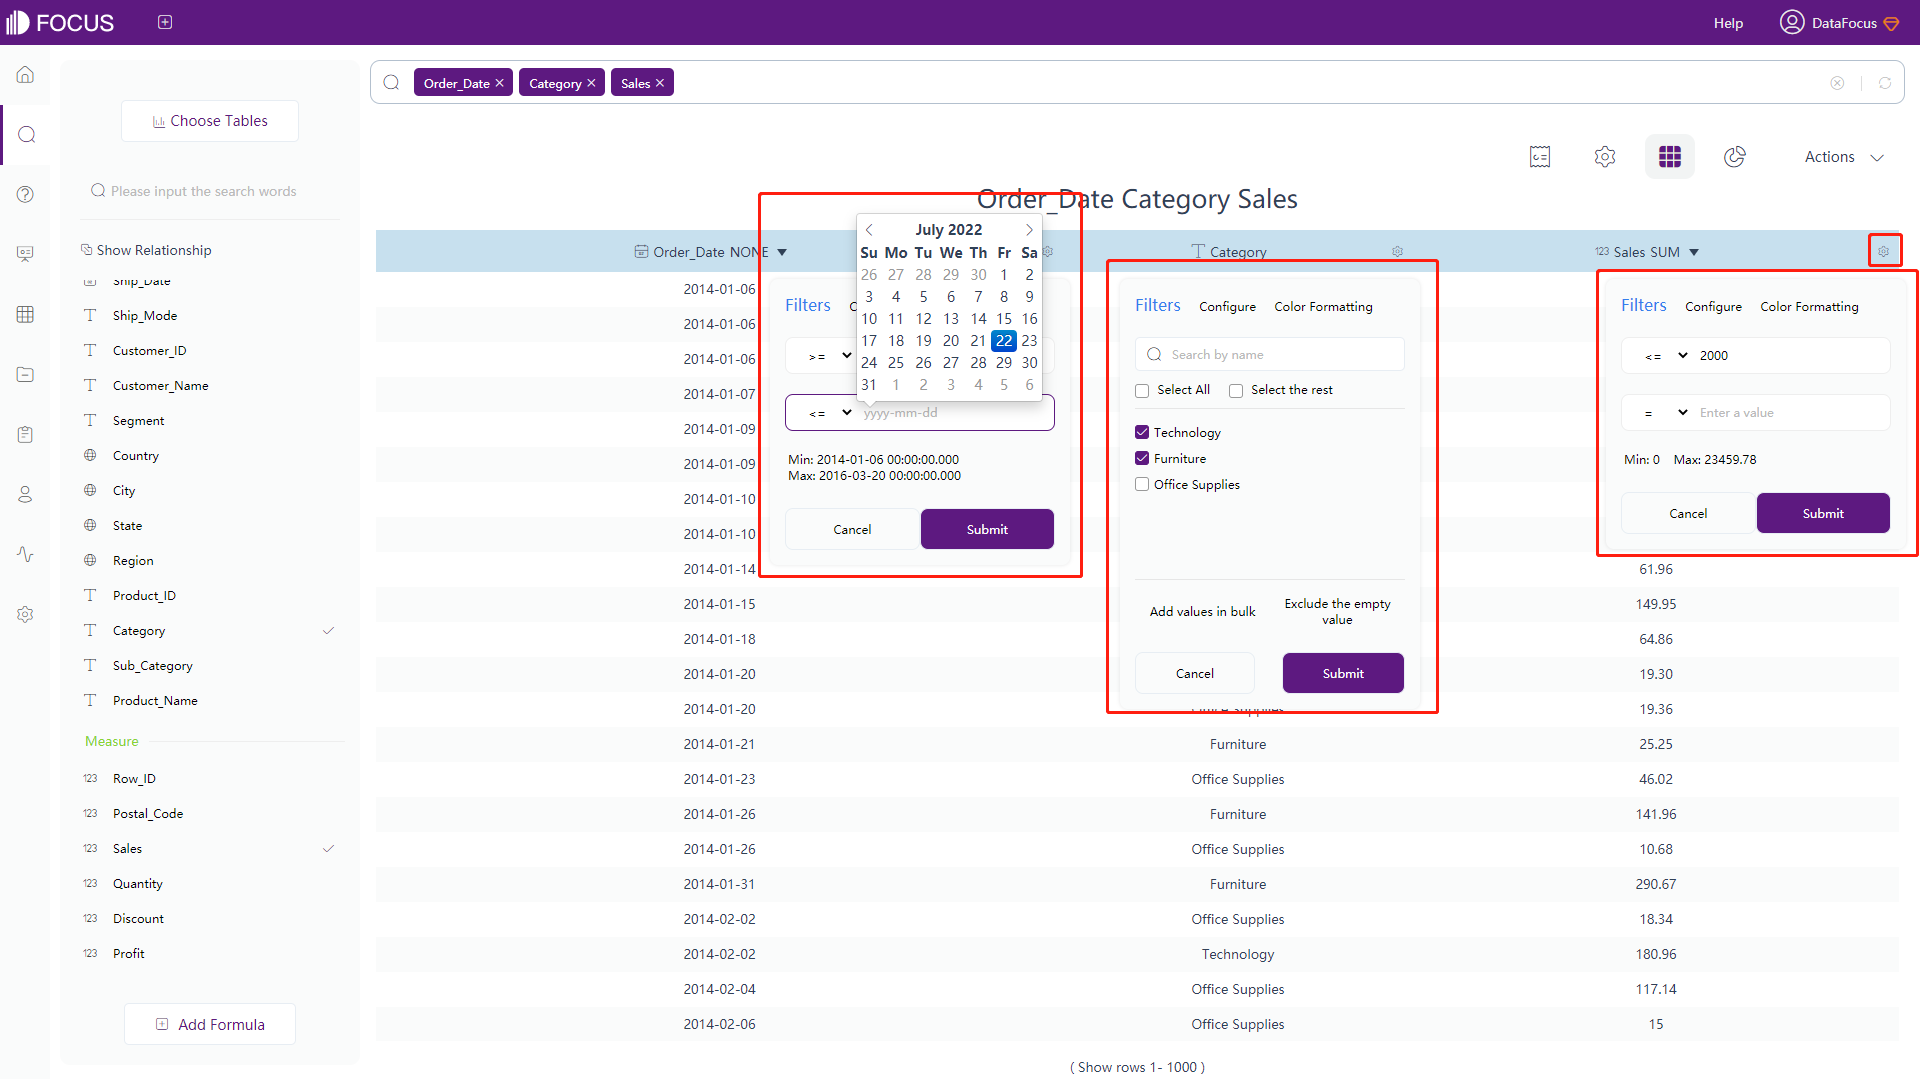
The third one is to filter on the axes of the graphical interface.
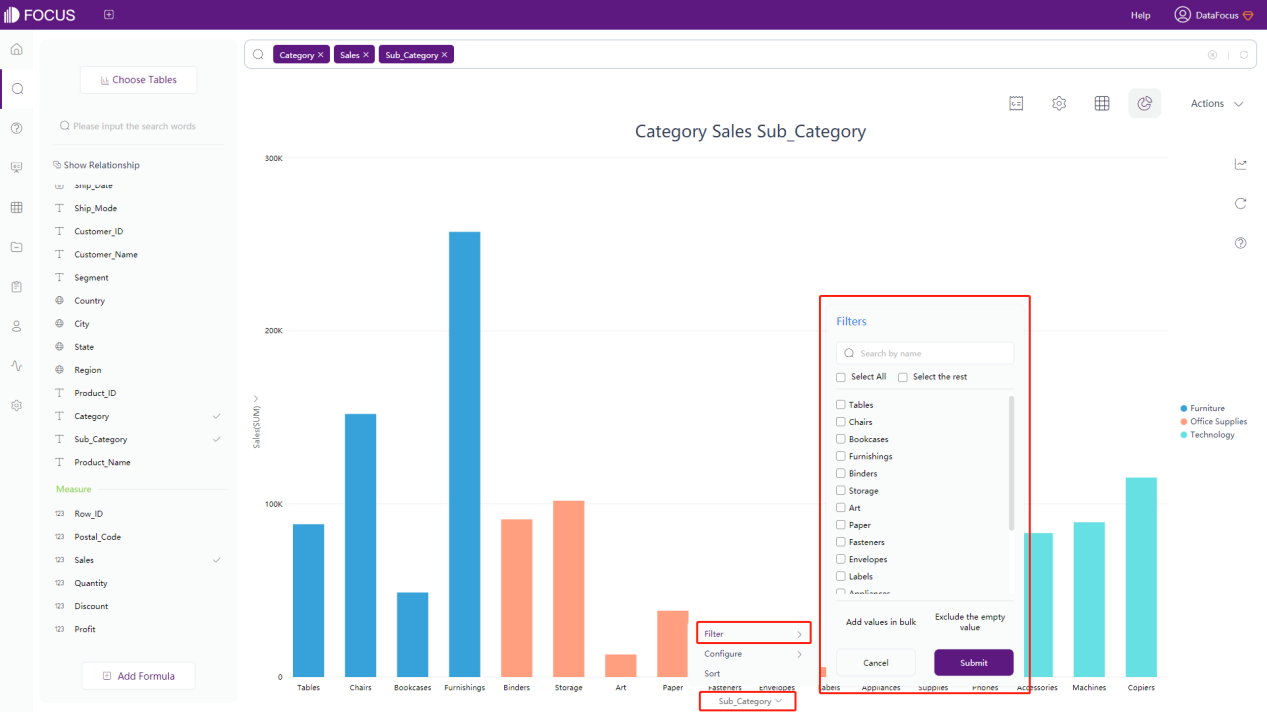
The last one is only for non-time Attribute columns. Similar to the third one, it also filters on the axes of the graphical interface.
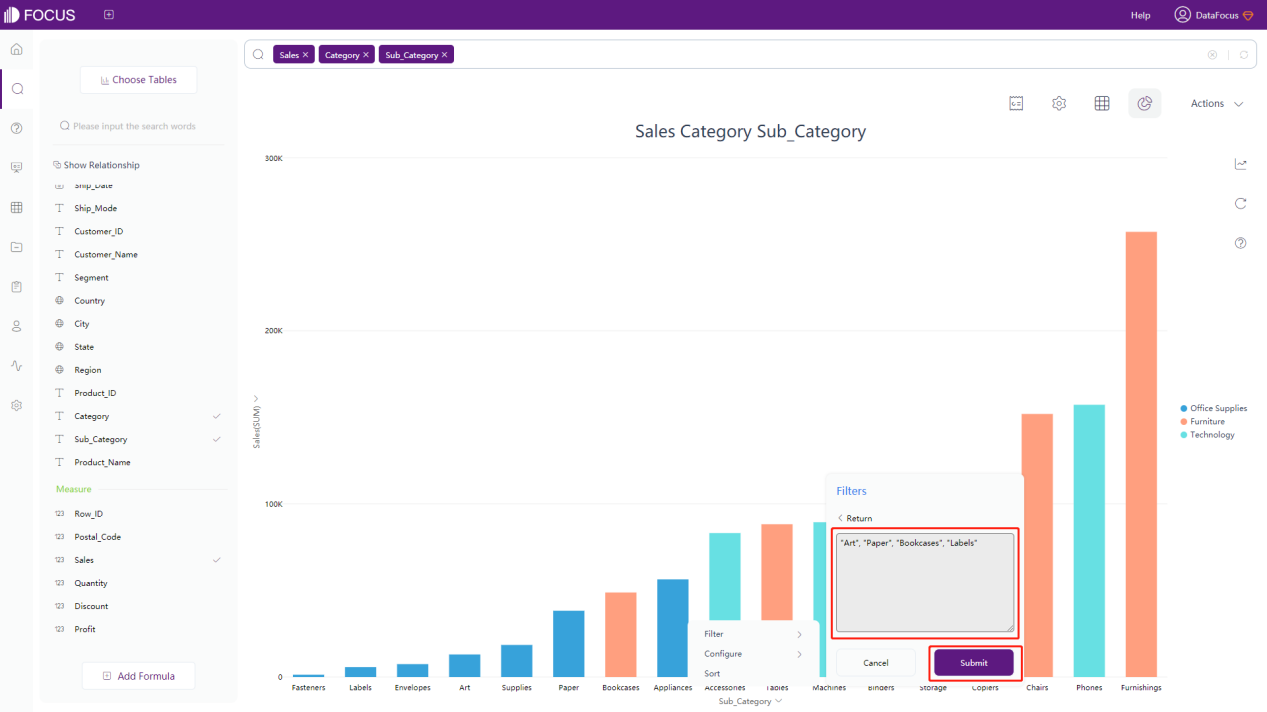
Though Tableau provides many kinds of different filters, the interface is a bit complex. DataFocus provides filters that are neat, easy to understand and use.
2.3.3 Formula
Tableau provides many different functions including number function, string function, date function, logical function, and etc., so that users can write their own formulas. However, the formula needs to be re-written each time creating a new chart.
DataFocus also offers various formulas, including number formula, string formula, date formula, logic formula, JSON formula, and etc. Also, DataFocus supports global formula, so that users do not have to re-write the formula each time creating a new graph. See the full list of formulas supported by DataFocus here: formula-list.
2.3.4 Deployment
Tableau software has both on-premises and cloud-based versions. Tableau Cloud is a SaaS deployment built to serve users with a shared compute environment. However, when comes to data connection, data processing or sharing, sometimes users need Tableau Server, Tableau Prep and Tableau Public to fulfill advanced needs.
DataFocus provides on-premises and cloud-based versions as well. DataFocus Cloud is a SaaS product that provides one-stop service. Users can process, analyze data, realize visualization, and share resources with other collaborators anywhere anytime. DataFocus Cloud offers a structural and neat collaboration system, which helps teams better manage resources.
2.4 Data Processing
In terms of data processing, the table below shows the differences in several aspects.
| Aspects | Tableau Cloud | DataFocus Cloud |
|---|---|---|
| Relate Tables | Relationships & joins are different.Relationship: Does not merge;Join: Merge 2 tables into 1 table. | Using intermediate join tables, users can join different tables and then choose data columns freely. |
| Clean Data | On Tableau Cloud, data interpreter is used to detect titles, merged header cells and etc., where there are many limitations. Data cleaning preparation is mainly carried out in Tableau Prep. | Data cleaning is mainly realized by creating intermediate tables, where users can filter and delete columns, merge data, and etc. |
| Filters | The difference in terms of filters is described in section 2.3.2. | |
| Edit Name & Type of Field/Column | Name and type of fields can be edited on both data source page and worksheet page. | Name and type of fields can be edited on both search analysis page and data source module. |
| Conversion between Rows & Columns | It mainly supports pivoting data in certain types of data sources from columns to rows. The structure of data source would be changed accordingly. When dealing with other data sources, users can use custom SQL (Tableau Desktop). | It supports converting between rows and columns freely on search analysis page, and thus the structure of the original data source would remain the same. The conversion can be canceled at any time. |
| Split Field/Column | Not applicable on Tableau Cloud, it can be realized on Tableau Desktop. | Splitting column is supported. The split number (number of columns after splitting) and split delimiter (could be multiple) can be customized. |
| ETL Tools | It integrates industry-leading tools like Informatica and Alteryx right into workflow. | It provides its own ETL tool to directly use in the system, so that data can be extracted from multiple sources. |
2.5 Visualization
In terms of visualization, the differences between Tableau and DataFocus are described in three aspects: table, chart, and dashboard.
2.5.1 Table
Within Tableau, text table and highlight table show the detailed information of data. The text, color, marks, and etc of displayed data can be customized.
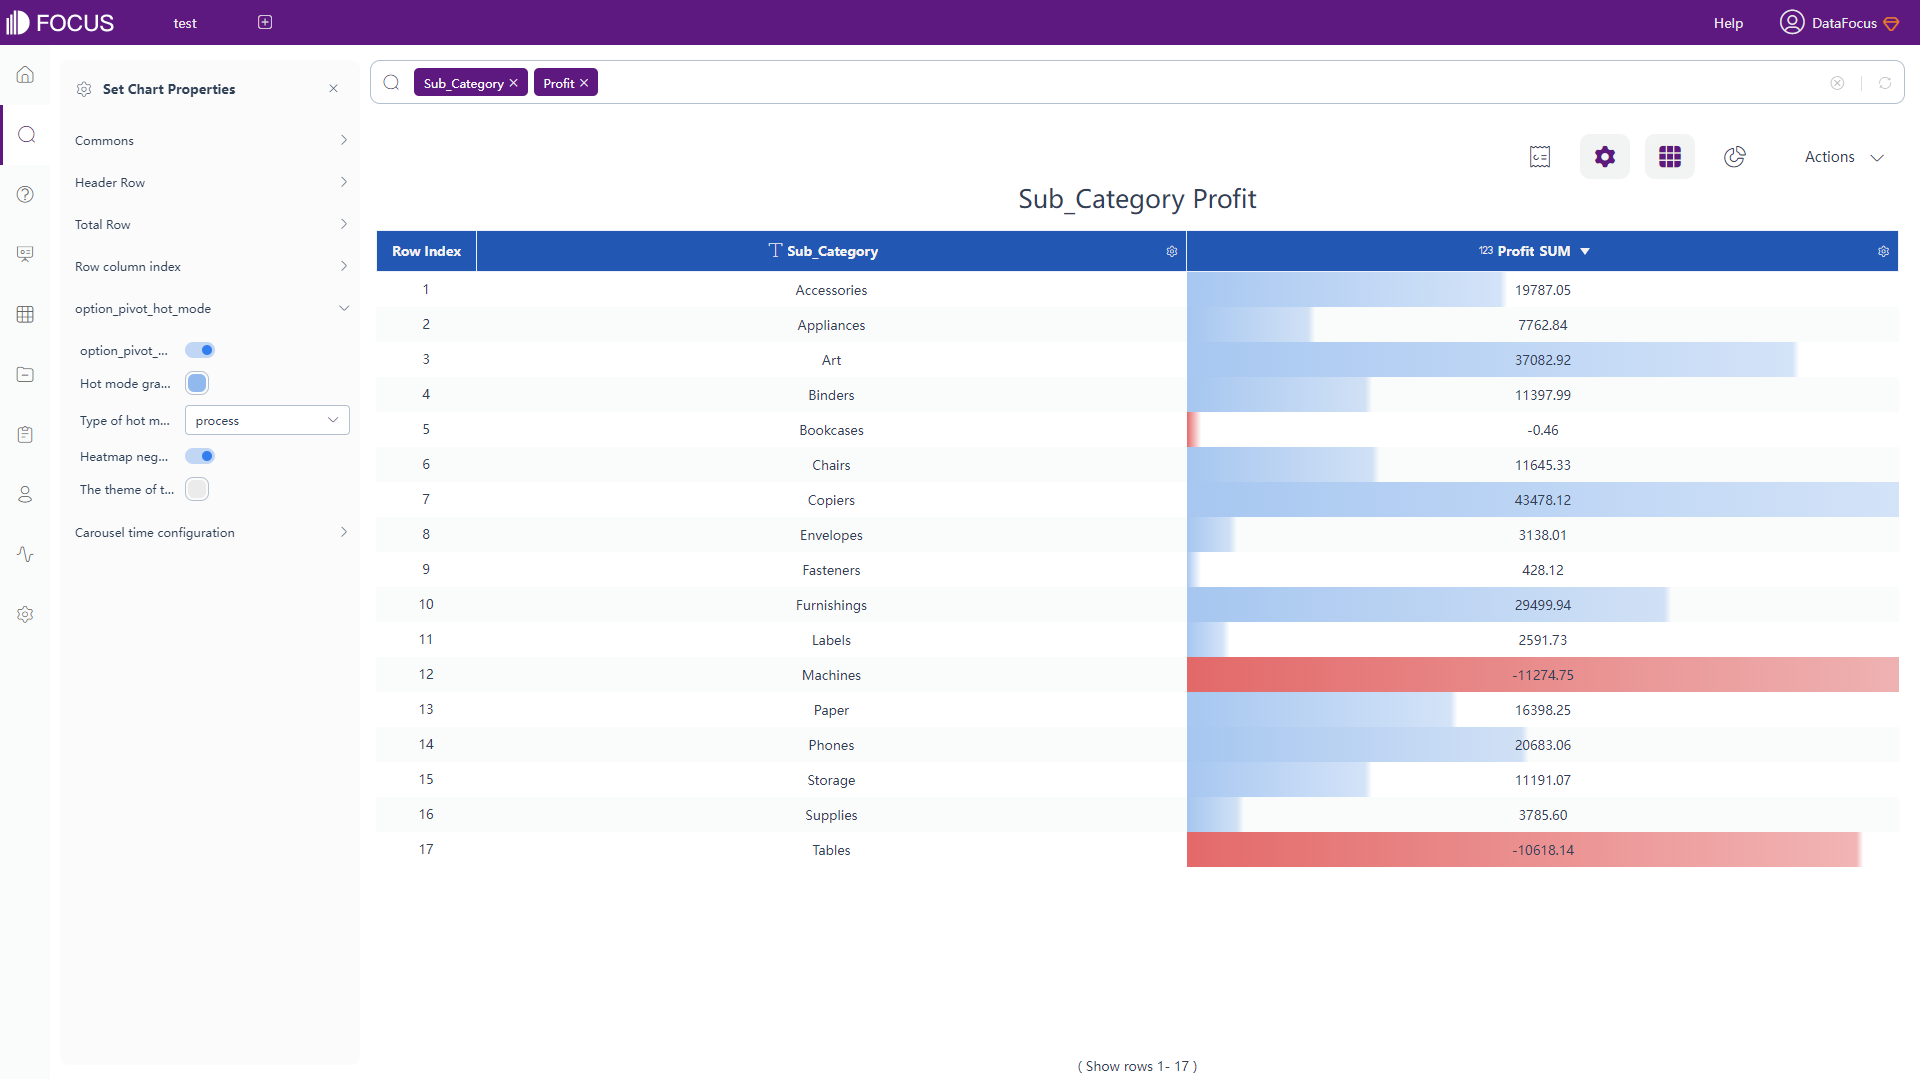
Within DataFocus, there are three kinds of tables.
One is grid table, which can show any data in two-dimensional table format. Also, as shown in figure 2-6, you can add headers, index, total row, display in heatmap mode, display negative numbers in red, and etc.
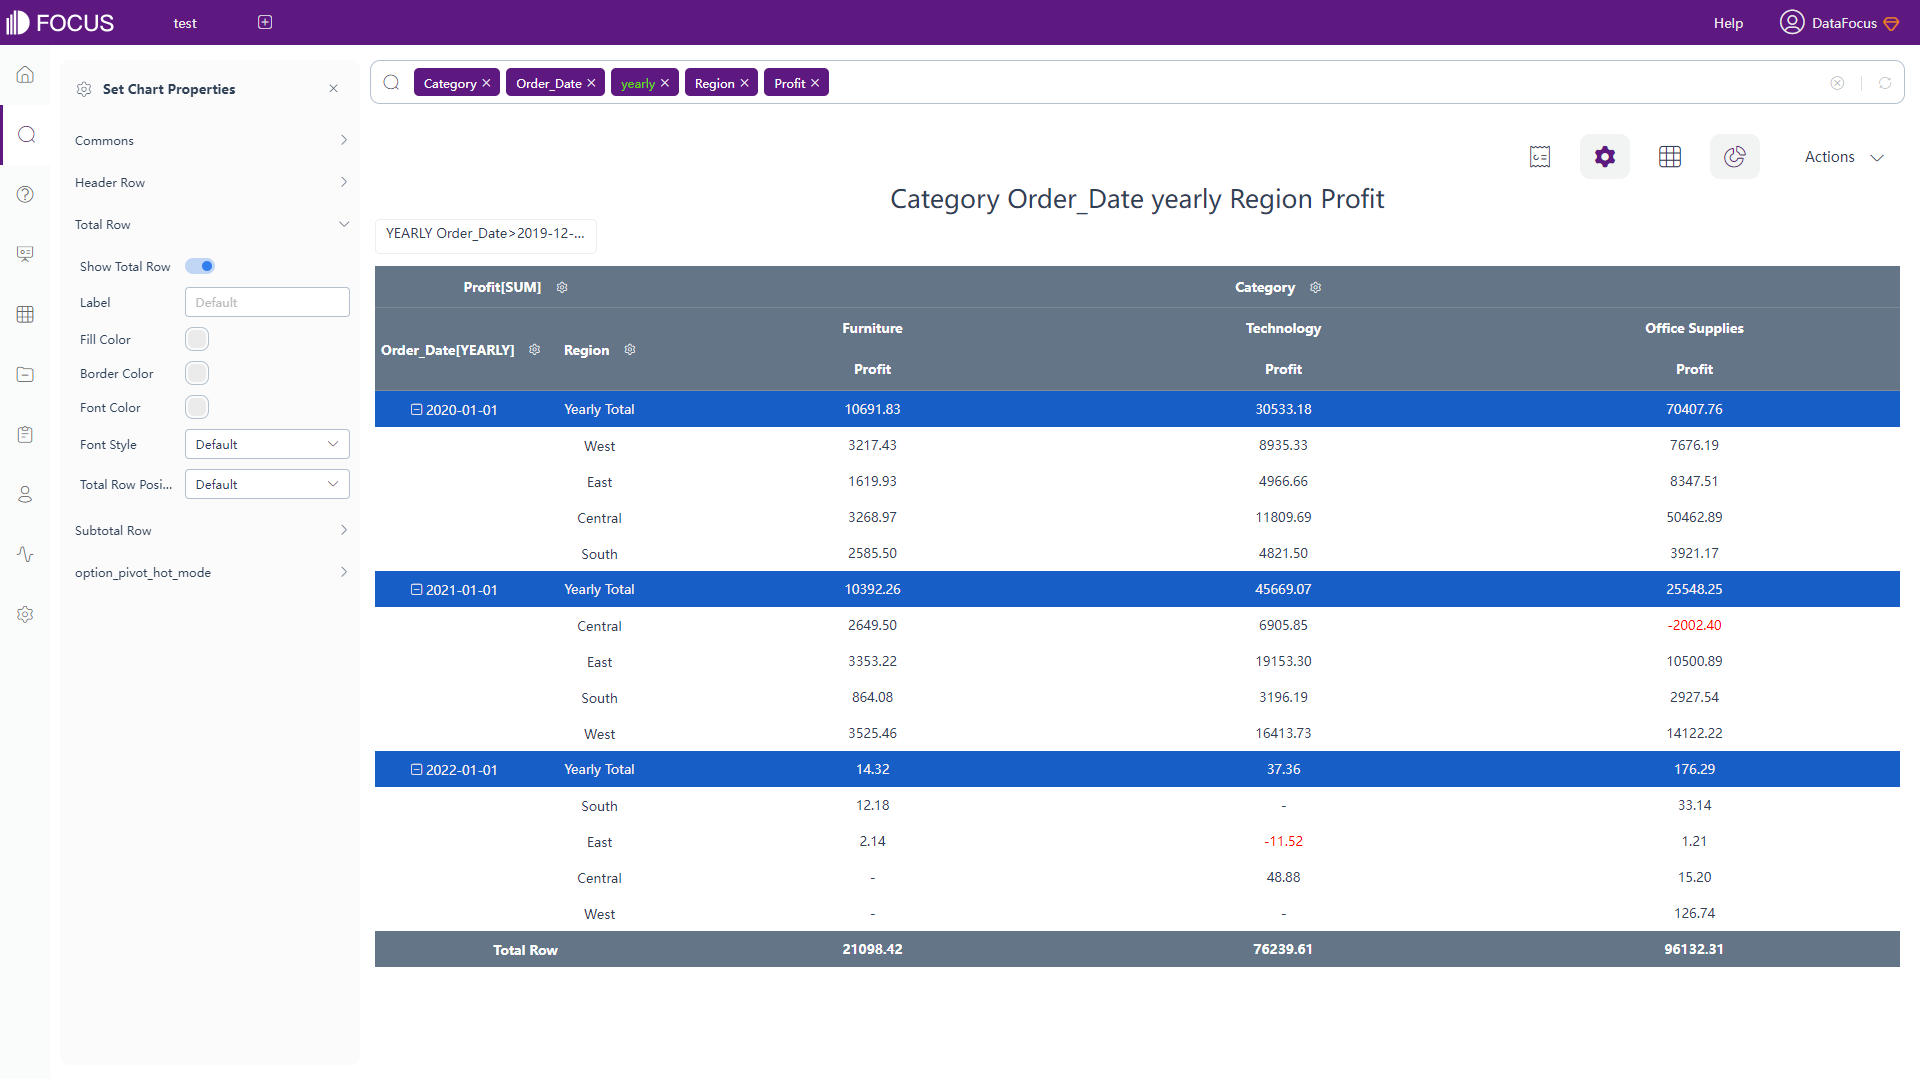
Another is pivot table, which shows data in a tree structure. It requires at least 2 attributes as well as 1 measure. Similar to grid table, you can add total row, display negative numbers in red, and etc.
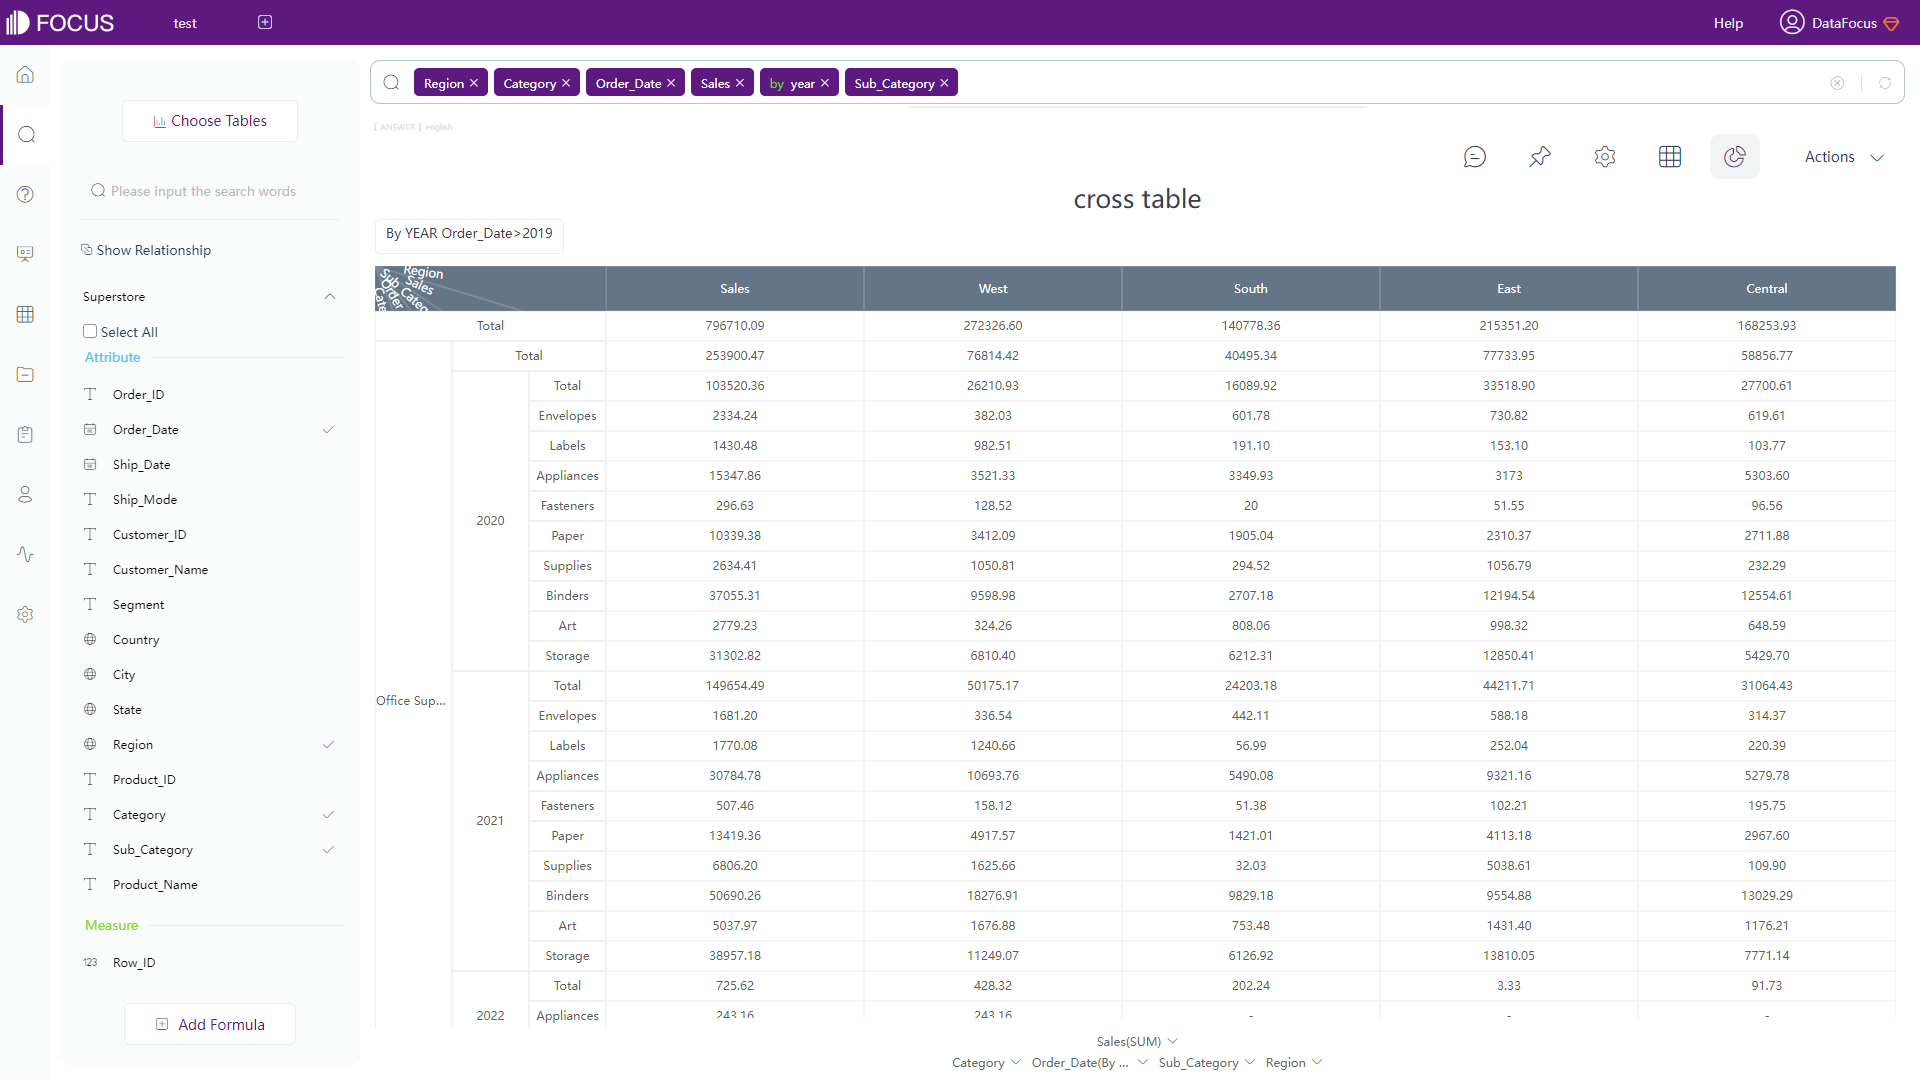
The last one is cross table, which structures and summarize data in multiple-dimensional table format. Therefore, it fits most of the complicated structure needs. You can choose to pin specific columns as well as row, add top as well as left header, add summarized result, and etc.
2.5.2 Chart
There are 15 different common chart types in Tableau, including the two tables mentioned above, and several advanced chart types such as Pareto chart, population pyramid, and etc. The visualization is beautiful, though some may require complex operations.
DataFocus supports over 50 types of charts. Except the common graphics like bar chart and pie chart, the variations of these charts are also supported, such as horizontal bar chart, stacked bar chart, ring chart, sunburst diagram and etc. Therefore, without complicated operations, users can create various charts easily.
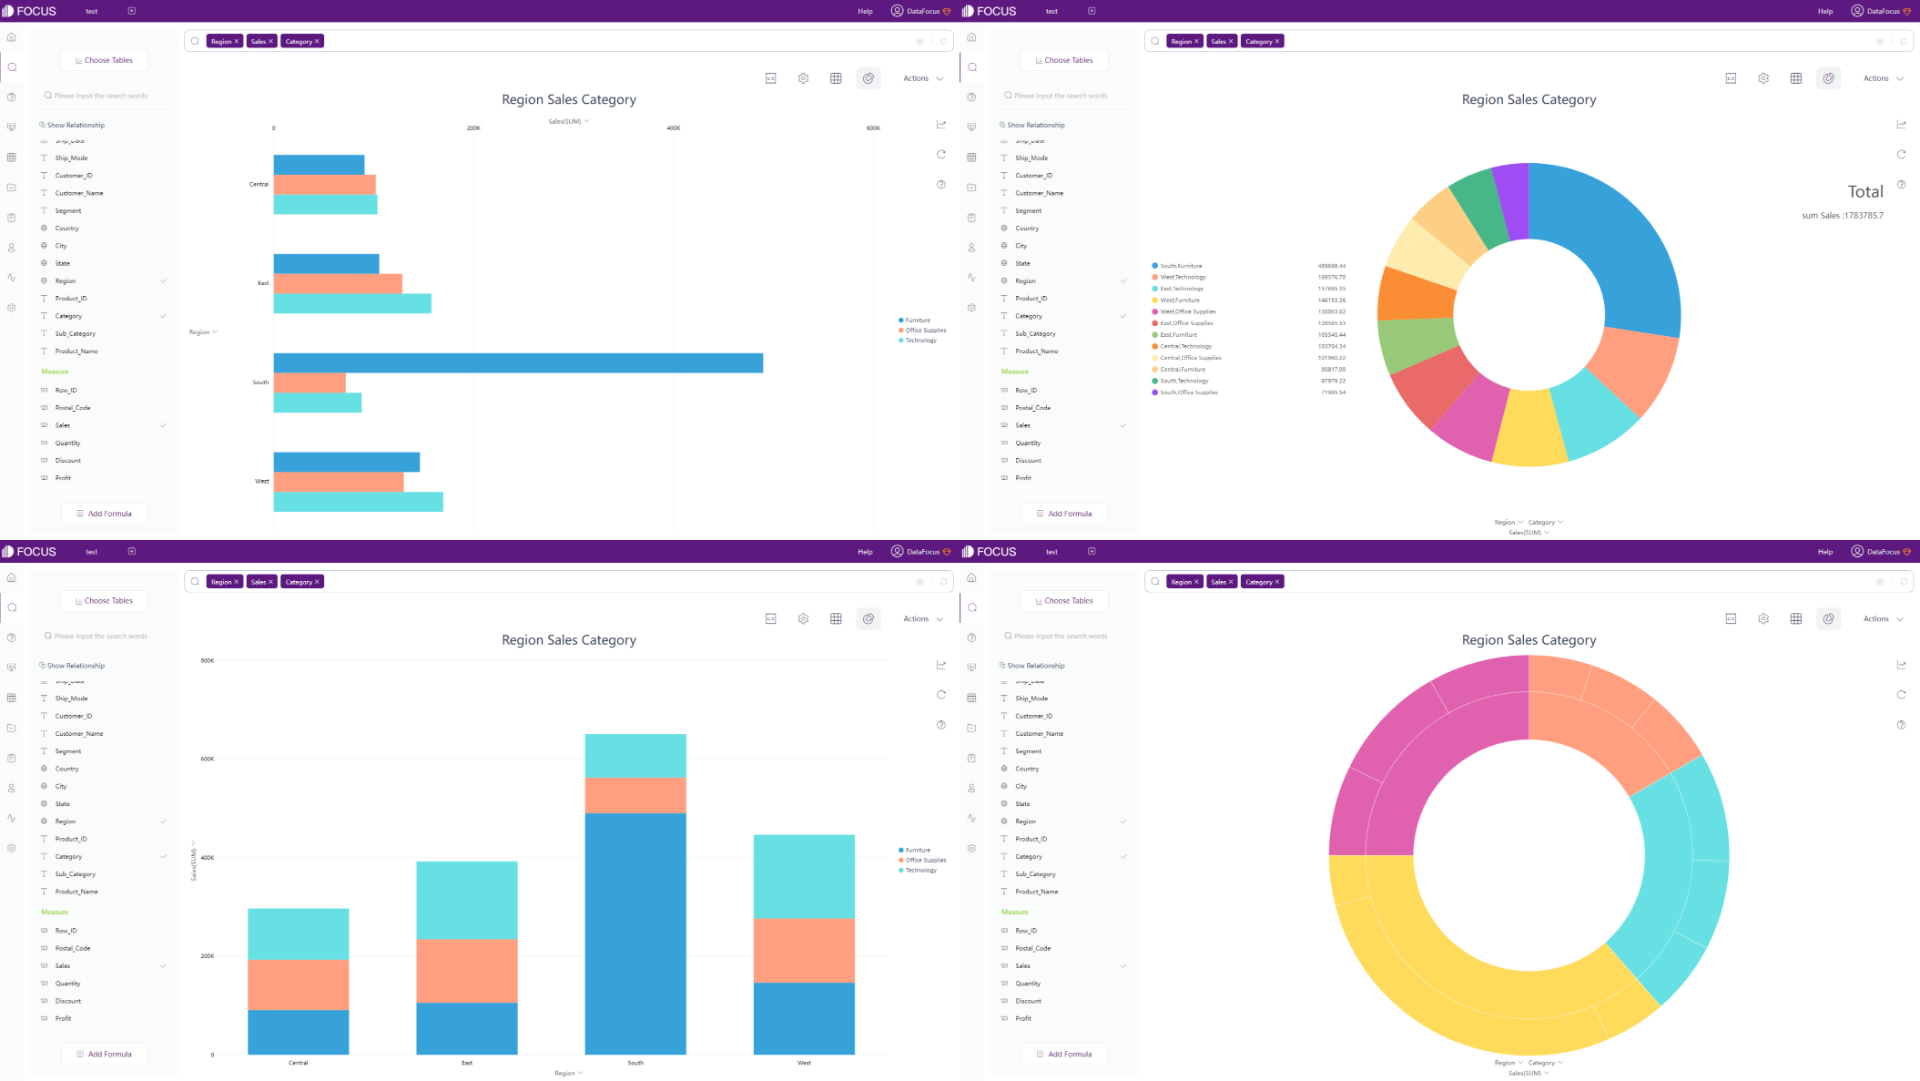
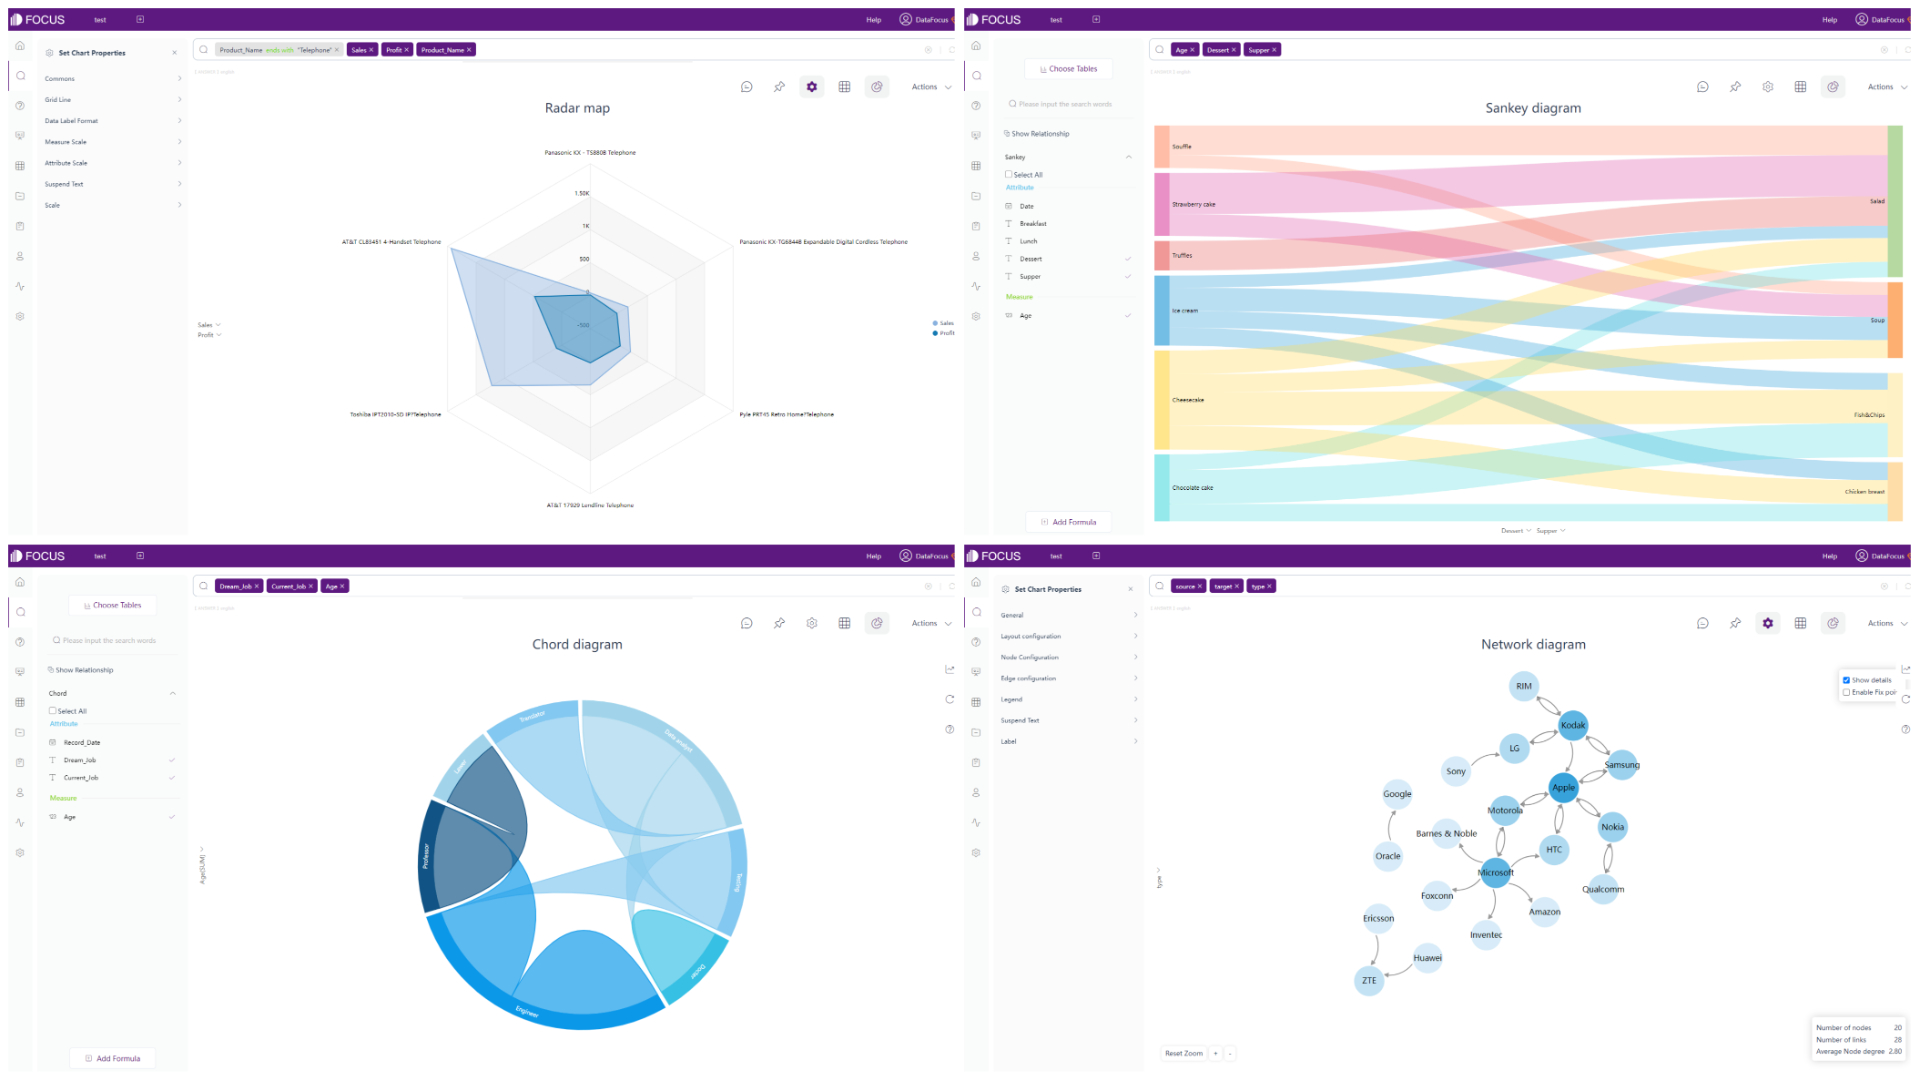
DataFocus also supports various advanced charts, such as radar map, chord diagram,sankey diagram, network diagram, and etc.
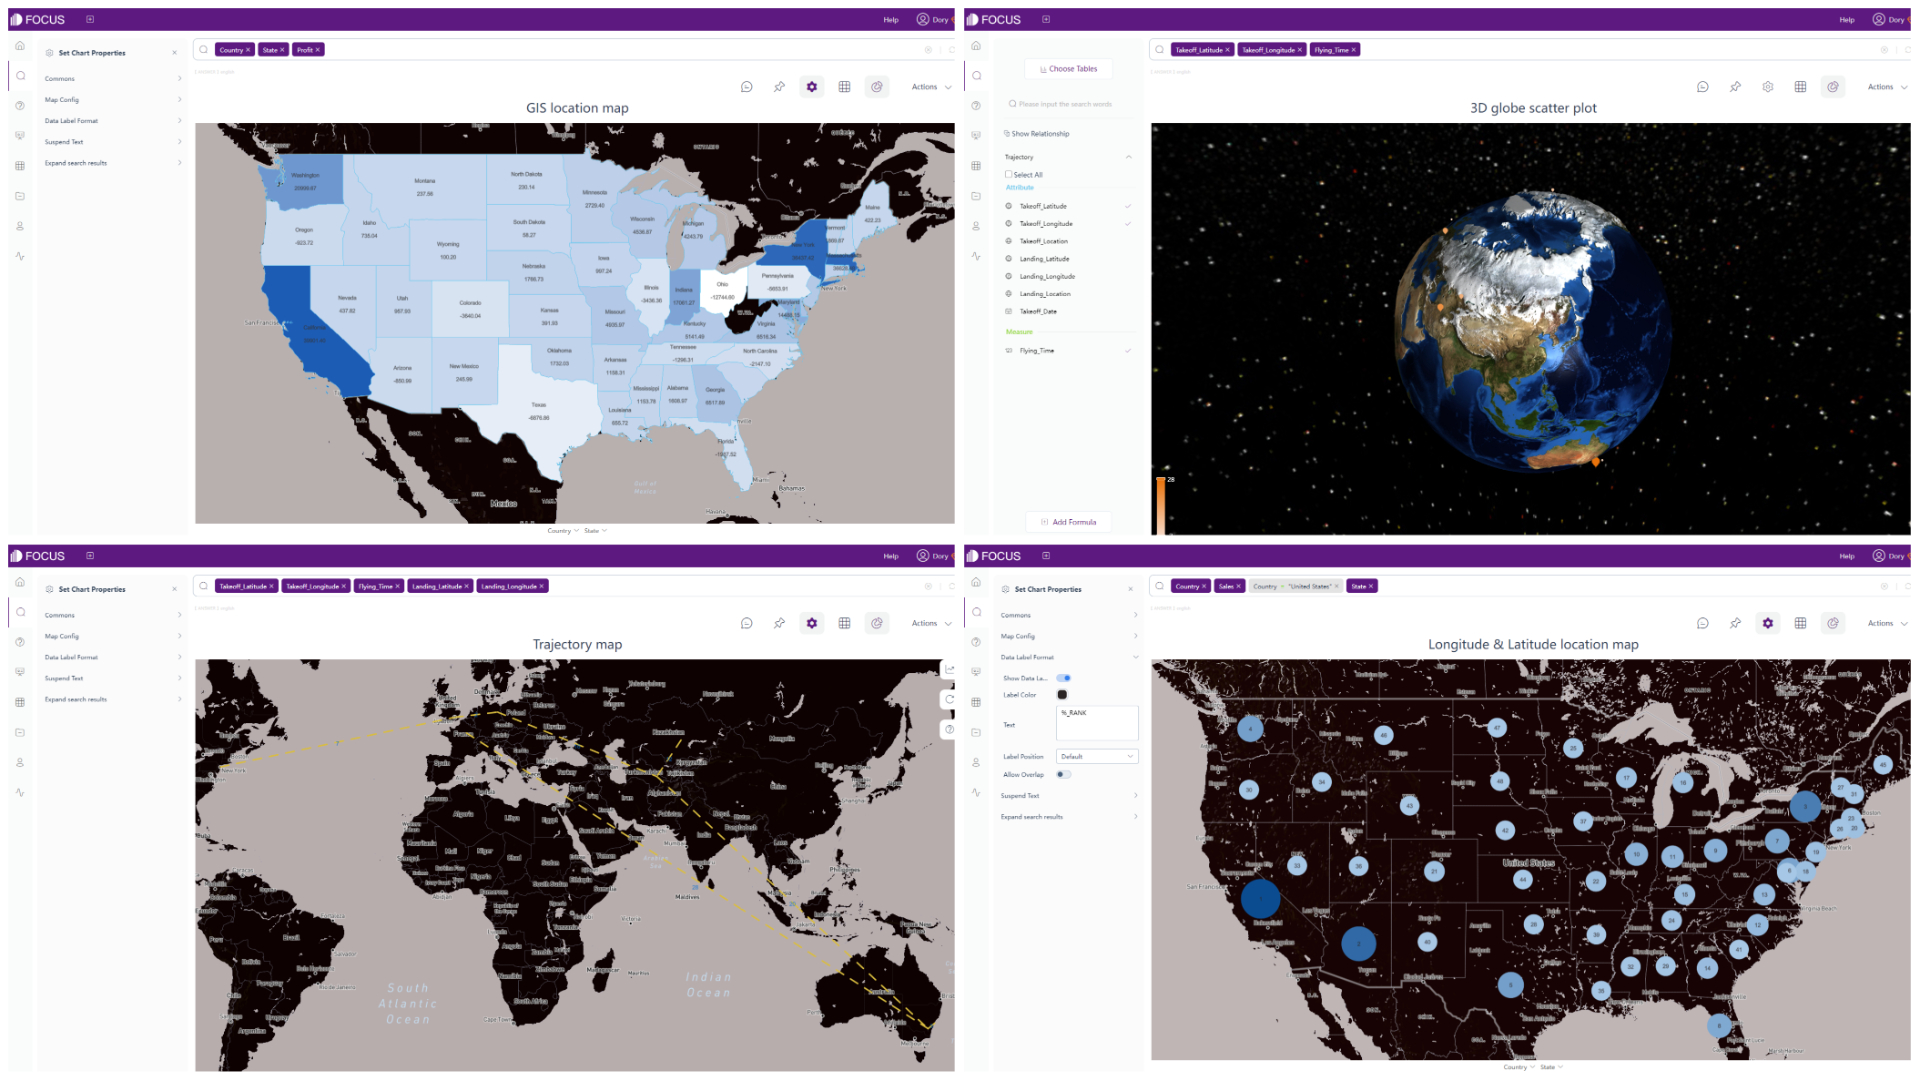
In terms of map, there are also a lot of different kinds of maps, including GIS location map, 3D globe scatter plot, trajectory map, longitude & latitude location map, and etc. What’s more, users can add their own maps or geographical data to the system.
Other than static charts, DataFocus also provides dynamic graphs. Time series plots including time series bubble chart, time series scatter plot, and etc., show data change in carousel.
2.5.3 Dashboard
There is no doubt that Tableau is one of the industry-best at data visualization. With a high degree of customization, Tableau can provide beautiful dashboards full of vivid interactive visualizations.
Though there are many resources online, users can download dashboard templates, Tableau itself does not provide templates. Users need to download template workbook using Tableau Desktop first, while Tableau Cloud does not support this.
DataFocus provides plenty of templates that fit various needs inside the system, which can be directly used when creating a new dashboard.
DataFocus also provides a high degree of customization. There are two types of layout: grid layout, where you can use grids to help locate answers (charts) and free layout, where you can place answers freely.
Other than that, DataFocus has a series of material components, such as tabs and Iframe (add a website), which can be added to the dashboard to make the visualization more complete.
2.6 Resource Management
According to Tableau: “Tableau Catalog, Tableau Prep Conductor, virtual connections, and data policies are licensed through data management”. Users can manage Tableau contents and data assets utilizing what mentioned above.
Without using any external resources, DataFocus Cloud provides a exhaustive system to manage resources. Users can use tags to classify and quickly find resources. Also, Each resource can be assigned to a owner, with role management, resources can be managed uniformly.
2.7 Collaboration
By publishing worksheets or dashboards to Tableau Server or Tableau Cloud with web edit permissions, teams can collaborate to make changes, which makes work efficient in some extent.
DataFocus Cloud offers a comprehensive management, from user, roles, to resources. By configuring resources for roles and assigning different roles to different users/departments, packaged resources can be assigned to specific users/departments. Therefore, different users can view as well as deal with different kinds of data.
Also, DataFocus has 2 different ways of sharing resources. One is within the system, where the shared user needs to have its own account. Another is external viewing address, where anyone with any device can view the resource through the website link or QR code.
2.8 Cost
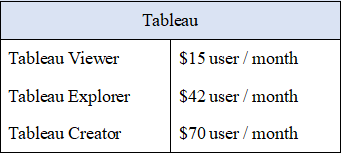
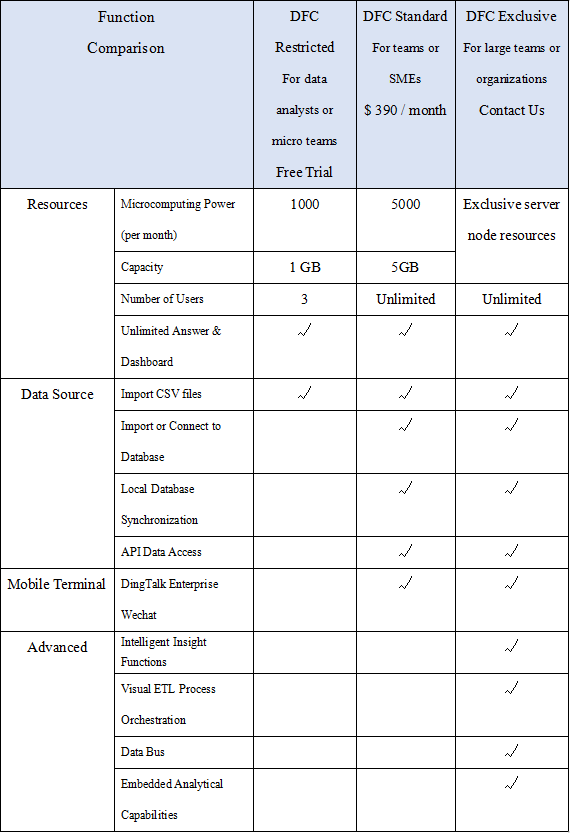
The price comparison is shown below in the tables, where Tableau charges per user and DataFocus charges by capacity.
Charging by user is on the one hand expensive and difficult to scale across a large number of users (cost increases linearly), and is on the other hand hard for users to evaluate the cost.
Charging by capacity is more fair for users, more convenient to promote within the organization, and much less sensitive to the number of users.
3. Conclusion
Both Tableau and DataFocus are excellent data analysis tools.
Users who are advanced data analysts would prefer Tableau since it can provide gorgeous visualization, while novice data analyst and business elites without experience may feel overwhelmed when learning how to use Tableau. Therefore, they may prefer DataFocus.
Though DataFocus still has limits, such as supporting only few choices of filters, formulas, and hard to change column type after importing, it is still growing and has its own advantages. Compared to Tableau, DataFocus is simpler to operate, add filters, add formulas, process data. Also, DataFocus provides more visualization choices especially in terms of advanced charts. What’s more, with a more fair charge, DataFocus offers a comprehensive system for teams to organize resources and collaborate. Welcome to try it here.
